4. Assessment of building damage due to ground motion
There are many causes of building damage, for example ground motion, liquefaction, ground failure and others. In this chapter, we introduce some assessment methods for building damage due to ground motion.
The building structure in Japan can be divided to two categories, which are "wooden building" and "non-wooden building". So, the assessment methods for building damage due to ground motion are introduced separately for "wooden building" and "non-wooden building".
4.1.Assessment of wooden building damage
4.1.1.Murao and Yamazaki (2000)(1)Input/Output
(2)Outline of the Method
Murao and Yamazaki (2000) analyzed the damage data due to the 1995 Hyogo-Ken Nanbu Earthquake, and proposed fragility curves for wooden buildings against peak ground velocity. The fragility curves in terms of the structural type and construction age were constructed using the building damage data of Nada Ward surveyed by Kobe City for the purpose of property tax reduction.
Å@
Fig.4.1.1 Fragility curves of wooden buildings for damage grade "Zenkai" according to the construction age
Å@
Å@
Å@
Fig.4.1.2 Fragility curves of wooden buildings for damage grade "Hankai" or more serious according to the construction age
The fragility curves are expressed with log normal distributions as follows.
![]()
![]() : Damage ratio
: Damage ratio
![]() : Peak ground velocity
: Peak ground velocity
![]() : Standard normal distribution with mean value
: Standard normal distribution with mean value
![]() and standard deviation
and standard deviation ![]() , which are shown in Table 4.1.1
, which are shown in Table 4.1.1
Table 4.1.1 Coefficients of fragility curves (Murao and Yamazaki, 2000)
|
Construction age |
Damage grade "Zenkai" |
Damage grade "Hankai" or more serious |
||
|
|
|
|
|
|
|
-1951 |
4.36 |
0.411 |
3.66 |
0.674 |
|
1952-61 |
4.44 |
0.353 |
3.97 |
0.490 |
|
1962-71 |
4.45 |
0.342 |
4.02 |
0.456 |
|
1972-81 |
4.73 |
0.378 |
4.25 |
0.395 |
|
1982-94 |
5.12 |
0.496 |
4.61 |
0.474 |
|
All |
4.51 |
0.410 |
4.07 |
0.514 |
The ratio of "Hankai" or more serious damage
The number of damaged buildings for each damage grade can be estimated by using these fragility curves, peak ground velocity and the number of the existing buildings in the studied area.
(3)Note
This method can be applied to the case in which the range of PGV is 40-180 cm/s.
(4)Reference
Murao, O. and F. Yamazaki (2000) Development of fragility curves for buildings based on damage survey data of a local government after the 1995 Hyogoken-Nanbu Earthquake, J. Struct. Constr. Eng., AIJ, 527, 189-196 (in Japanese with English abstract).
4.1.2.Tokyo Metropolitan Disaster Prevention Council (1985)(1)Input/Output
(2)Outline of the Method
The damage ratio of wooden buildings for each damage grade is estimated by dynamic non-linear response analysis in this method.
The wooden buildings are classified into five groups, which are shown in Table 4.1.2, according to the construction age, the number of stories and building use. The distributions of natural periods of wooden buildings are considered as standardized normal distributions as shown in Fig.4.1.3 and Table 4.1.3 for each group.
Table 4.1.2 Classification of wooden buildings
|
Construction age |
Residence limited |
Not residence limited |
||
|
1 story |
2 stories |
1 story |
2 stories |
|
|
-1960 |
Group-1 |
Group-1 |
Group-1 |
Group-1 |
|
1951-1960 |
Group-3 |
Group-2 |
Group-2 |
Group-2 |
|
1961-1970 |
Group-4 |
Group-4 |
Group-4 |
Group-3 |
|
1971- |
Group-5 |
Group-5 |
Group-5 |
Group-4 |
Å@
Å@
Fig.4.1.3 Distributions of natural periods of buildings
Table 4.1.3 Coefficients of normal distributions for natural periods of buildings
|
Mean value |
Standard deviation |
|
|
Group-1 |
0.50 |
0.13 |
|
Group-2 |
0.40 |
0.13 |
|
Group-3 |
0.36 |
0.10 |
|
Group-4 |
0.33 |
0.10 |
|
Group-5 |
0.28 |
0.10 |
The relationship between yield seismic coefficient and natural period of wooden building is estimated based on the damage investigation data in 1923 Kanto Earthquake as follows.
Å@

Å@
![]() : Yield seismic coefficient of wooden building based on the damage data of 1923 Kanto Earthquake
: Yield seismic coefficient of wooden building based on the damage data of 1923 Kanto Earthquake
![]() : Natural period of wooden building [s]
: Natural period of wooden building [s]
Å@
Å@
Fig.4.1.4 Relationship between yield seismic coefficient and natural period of wooden building based on the damage data of 1923 Kanto Earthquake
![]() , which is
, which is ![]() , is considered as the response displacement of first stiffness decrease point in dynamic non-linear response analysis by two-dimensional bi-linear model as shown in Fig.4.1.5. There is other turning point of hysteresis curve, which is critical point to plastic deformation from elastic deformation and the response displacement of that point is
, is considered as the response displacement of first stiffness decrease point in dynamic non-linear response analysis by two-dimensional bi-linear model as shown in Fig.4.1.5. There is other turning point of hysteresis curve, which is critical point to plastic deformation from elastic deformation and the response displacement of that point is
![]() (
(![]() ) as shown in Fig.4.1.5 in the model.
) as shown in Fig.4.1.5 in the model.
Å@
Å@
Fig.4.1.5 Two-dimensional bi-linear model
Å@
![]() : Gravity acceleration
: Gravity acceleration
![]() : Circular constant
: Circular constant
The wooden building damage grade is judged to be "Hankai", when the displacement exceeds
![]() as a result of dynamic non-linear response analysis by two-dimensional bi-linear model, where the time-history waveform of ground motion is used as an input. The damage grade is judged to be "Zenkai", when the displacement exceeds
as a result of dynamic non-linear response analysis by two-dimensional bi-linear model, where the time-history waveform of ground motion is used as an input. The damage grade is judged to be "Zenkai", when the displacement exceeds
![]() . The value of 0.05 is used as the damping factor in this method.
. The value of 0.05 is used as the damping factor in this method.
(3)Note
This method is constructed based on the wooden building damage data in 1923 Kanto Earthquake. After the earthquake, the building constructing code and the laws about building construction in Japan was established or revised. The quake-resistant engineering was advanced also.
Therefore, the strength of wooden building is considered to have changed after the publication of this method, and there are some applied cases where new building groups are added to Fig.4.1.3 or yield seismic coefficient of wooden building is increased.
(4)Reference
Tokyo Metropolitan Disaster Prevention Council (1985) Tama chiiki ni okeru zisin higai no soutei ni kansuru houkokusho (In Japanese. Webmaster translates the title "Report of earthquake damage assessment in Tama region").
4.1.3.Kanagawa Prefecture Office (1993)(1)Input/Output
(2)Outline of the Method
This method is one of the applied cases derived from above-mentioned method of Tokyo Metropolitan Disaster Prevention Council (1985). In this method, a new building group is added to the classification of wooden buildings in above-mentioned method, and response spectrum is used instead of doing the dynamic non-linear response analysis using time-history waveform of ground motion.
Applied classification of wooden buildings is shown in Table 4.1.4. The distributions of natural periods of buildings are considered as standardized normal distributions as shown in Table 4.1.5 for each group.
Table 4.1.4 Classification of wooden buildings
|
Construction age |
Residence limited |
Not residence limited |
||
|
1 story |
2 stories |
1 story |
2 stories |
|
|
-1960 |
Group-1 |
Group-1 |
Group-1 |
Group-1 |
|
1951-1960 |
Group-3 |
Group-2 |
Group-2 |
Group-2 |
|
1961-1970 |
Group-4 |
Group-4 |
Group-4 |
Group-3 |
|
1971-1980 |
Group-5 |
Group-5 |
Group-5 |
Group-4 |
|
1981- |
Group-6 |
Group-6 |
Group-6 |
Group-5 |
Table 4.1.5 Coefficients of normal distributions for natural periods of buildings
|
Mean value |
Standard deviation |
|
|
Group-1 |
0.50 |
0.13 |
|
Group-2 |
0.40 |
0.13 |
|
Group-3 |
0.36 |
0.10 |
|
Group-4 |
0.33 |
0.10 |
|
Group-5 |
0.28 |
0.10 |
|
Group-6 |
0.25 |
0.10 |
Because response spectrum is used instead of doing the dynamic non-linear response analysis by using time-history waveform of ground motion, the plastic behavior of wooden building cannot be taken into consideration without some improvements.
The threshold of damage grade "Taiha" is decided as the value of response seismic coefficient, which is gained so that the area of "![]() " can be equal to the area of "
" can be equal to the area of "![]() " as shown in Fig.4.1.6. This operation is based on the theory that the energy indicated by "
" as shown in Fig.4.1.6. This operation is based on the theory that the energy indicated by "![]() " is equal to one indicated by "
" is equal to one indicated by "![]() ". The damage grade is judged by comparing the threshold to the response seismic coefficient which is derived from response acceleration for natural period of building and gravity acceleration. The threshold is shown as follows.
". The damage grade is judged by comparing the threshold to the response seismic coefficient which is derived from response acceleration for natural period of building and gravity acceleration. The threshold is shown as follows.
![]()
![]()
![]() : Response seismic coefficient
: Response seismic coefficient
![]()
![]() : Response acceleration
: Response acceleration
![]() : Gravity acceleration
: Gravity acceleration
![]() : Natural period of wooden building [s]
: Natural period of wooden building [s]
![]() : Yield seismic coefficient of wooden building based on the damage data of 1923 Kanto Earthquake
: Yield seismic coefficient of wooden building based on the damage data of 1923 Kanto Earthquake
Fig.4.1.6 Adjustment of thresholds to judge damage grade
![]()
(3)Note
The value of threshold to judge damage grade is derived from the wooden building damage data in 1923 Kanto Earthquake. Therefore, the note of this method is the same as one of the method of Tokyo Metropolitan Disaster Prevention Council (1985).
(4)Reference
Kanagawa Prefecture Office (1993) Kanagawa-ken seibu zisin higai soutei chousa houkokusho (in Japanese. Webmaster translates the title "Report of earthquake damage assessment in Kanagawa Prefecture").
4.1.4.Saga Prefecture Office (1997)(1)Input/Output
(2)Outline of the Method
This method is one of the applied cases derived from above-mentioned method of Tokyo Metropolitan Disaster Prevention Council (1985) so that the assessment of building damage can be done easily. In this method, the damage grade is not judged by the dynamic non-linear response analysis with time-history waveform of ground motion, but by empirical relationship between displacement response spectrum and peak ground acceleration.
The displacement response spectrum (damping factor = 5%) is considered as the function of peak ground motion, natural period of wooden building and soil type as follows.
![]() : Displacement response spectrum [cm]
: Displacement response spectrum [cm]
![]() : Peak ground acceleration [gal]
: Peak ground acceleration [gal]
![]() : Gravity acceleration [gal]
: Gravity acceleration [gal]
![]() : Natural period of wooden building [s]
: Natural period of wooden building [s]
![]() : Correction for soil type
: Correction for soil type
Soil type 1 (Rock) : ![]()
Soil type 2 (Diluvium, mainly) : ![]()
Soil type 3 (Alluvium, mainly) : ![]()
Soil type 4 (Soft, especially) : ![]()
This relationship is derived from maximum envelope of response spectra observed in some earthquakes. Therefore, the response displacement calculated by this relationship is considered to be overestimated, so that the value with 75% of
![]() is used to judge the building damage grade.
is used to judge the building damage grade.
The damage grade is judged to be "Hankai", when this reduced response displacement is more than 5.0 cm. The damage grade is judged to be "Zenkai", when the reduced response displacement is more than 10.0cm. The distributions of natural periods of wooden buildings in this method are the same as ones used in the method of Tokyo Metropolitan Disaster Prevention Council (1985).
(3)Note
The value of threshold to judge damage grade is derived from the wooden building damage data in 1923 Kanto Earthquake. Therefore, the note of this method is the same as one of the method of Tokyo Metropolitan Disaster Prevention Council (1985).
(4)Reference
Saga Prefecture Office (1997) Sinsai-tou higai simyureshon chousa, chousa houkokusho (in Japanese. Webmaster translates the title "Report of simulation survey of earthquake damage etc"), Institute of Lowland Technology of Saga University and Mitsubishi Research Institute, Inc.
Yamagata Prefecture Office (1997) Yamagata-ken zisin taisaku kiso chousa, chousa houkokusho (in Japanese. Webmaster translates the title "Report of basic investigation for measures against an earthquake in Yamagata Prefecture").
4.2.Assessment of non-wooden building damage
4.2.1.Murao and Yamazaki (2000)(1)Input/Output
(2)Outline of the Method
Murao and Yamazaki (2000) analyzed the damage data due to the 1995 Hyogo-Ken Nanbu Earthquake, and proposed fragility curves for non-wooden buildings against peak ground velocity. The fragility curves in terms of the structural type and construction age were constructed using the building damage data of Nada Ward surveyed by Kobe City for the purpose of property tax reduction.

Fig.4.2.1 Fragility curves of non-wooden buildings for damage grade "Zenkai" according to the structural type and the construction age
(RC: Reinforced Concrete, LGS: Light Gauge Steel)
Fig.4.2.2 Fragility curves of non-wooden buildings for damage grade "Hankai" or more serious according to the structural type and the construction age
The fragility curves are expressed with log normal distributions as follows.
![]()
![]() : Damage ratio
: Damage ratio
![]() : Peak ground velocity
: Peak ground velocity
![]() : Standard normal distribution with mean value
: Standard normal distribution with mean value
![]() and standard deviation
and standard deviation ![]() , which are shown in Table 4.2.1
, which are shown in Table 4.2.1
Table 4.2.1 Coefficient of fragility curves (Murao and Yamazaki, 2000)
| Structural type |
Construction age |
Damage grade "Zenkai" |
Damage grade "Hankai" or more serious |
||
|
|
|
|
|
||
|
RC (Reinforced Concrete) |
-1971 |
5.12 |
0.646 |
4.72 |
0.691 |
|
1972-81 |
5.33 |
0.575 |
4.85 |
0.612 |
|
|
1981-94 |
6.00 |
0.789 |
5.33 |
0.789 |
|
|
All |
5.50 |
0.705 |
4.99 |
0.716 |
|
|
Steel |
-1971 |
4.64 |
0.619 |
4.25 |
0.712 |
|
1972-81 |
4.97 |
0.490 |
4.49 |
0.549 |
|
|
1982-94 |
5.64 |
0.731 |
5.01 |
0.733 |
|
|
All |
5.14 |
0.628 |
4.69 |
0.672 |
|
|
LGS (Light Gauge Steel) |
-1971 |
4.70 |
0.550 |
4.41 |
0.504 |
|
1972-81 |
5.82 |
0.972 |
4.95 |
0.855 |
|
|
1982-94 |
6.19 |
1.101 |
5.28 |
0.865 |
|
|
All |
5.03 |
0.564 |
4.73 |
0.601 |
|
The ratio of "Hankai" or more serious damage
The number of damaged buildings for each damage grade can be estimated by using these fragility curves, peak ground velocity and the number of the existing buildings for the studied area.
(3)Note
This method can be applied to the case in which the range of PGV is 40-180 cm/s.
(4)Reference
Murao, O. and F. Yamazaki (2000) Development of fragility curves for buildings based on damage survey data of a local government after the 1995 Hyogoken-Nanbu Earthquake, J. Struct. Constr. Eng., AIJ, 527, 189-196 (in Japanese with English abstract).
4.2.2.Tokyo Metropolitan Disaster Prevention Council (1991), Kanagawa Prefecture Office (1993)(1)Input/Output
(2)Outline of the Method
The damage grade ratio of non-wooden building can be derived from comparison of the strength of the building and external force by ground motion. The former is seismic performance of the building;
![]() , and the latter is base shear coefficient;
, and the latter is base shear coefficient;
![]() . The thresholds of damage grade are shown in Table 4.2.2.
. The thresholds of damage grade are shown in Table 4.2.2.
Table 4.2.2 Thresholds of damage grade (Kanagawa Prefecture Office, 1993)
|
Structural type |
Damage grade |
|
|
"Taiha" (heavy) |
"Chuha" (moderate) |
|
|
RC/SRC |
|
|
|
Steel/LGS |
|
|
(RC: Reinforced Concrete, SRC: Steel-framed Reinforced Concrete,
LGS: Light Gauge Steel)
Nakano and Okada (1989) investigated
![]() values of 1615 of exiting RC public buildings constructed before 1987 in Shizuoka Prefecture. The distributions of
values of 1615 of exiting RC public buildings constructed before 1987 in Shizuoka Prefecture. The distributions of
![]() values are assumed to be log-normal distributions as shown in Table 4.2.3, which is based on the results of the investigation of Nakano and Okada (1989).
values are assumed to be log-normal distributions as shown in Table 4.2.3, which is based on the results of the investigation of Nakano and Okada (1989).
Table 4.2.3 Coefficients of log-normal distributions for ![]() values of RC buildings
values of RC buildings
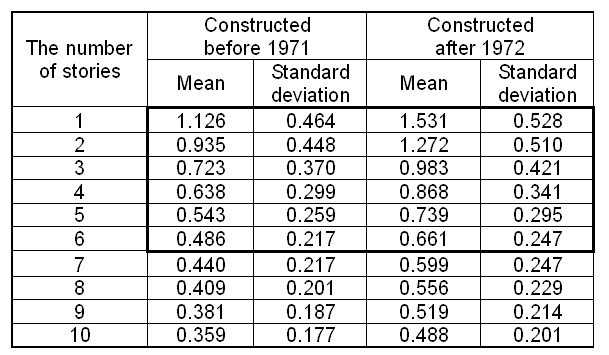
Coefficients inside of the thick frame of the table :
Actual measurement by Nakano and Okada (1989)
Furthermore,
![]() values of steel structure buildings are given by Kanagawa Prefecture Office (1993) as shown in Table 4.2.4.
values of steel structure buildings are given by Kanagawa Prefecture Office (1993) as shown in Table 4.2.4.
Table 4.2.4 Coefficients of log-normal distributions for
![]() values of steel structure buildings
values of steel structure buildings
|
Constructed before 1981 |
Constructed after 1982 |
||
|
Mean |
Standard deviation |
Mean |
Standard deviation |
|
0.300 |
0.15 |
0.408 |
0.16 |
Base shear coefficient;
![]() is given as follows.
is given as follows.
![]()
![]() : Acceleration response value [gal] at period
: Acceleration response value [gal] at period
![]()
![]() : Gravity acceleration [gal]
: Gravity acceleration [gal]
![]() : Correction for mode by soil-structure interaction
: Correction for mode by soil-structure interaction
![]() : Correction for damping by soil-structure interaction
: Correction for damping by soil-structure interaction
Damping factor of acceleration response spectrum is 5% for RC/SRC and 4% for steel structure. Other parameters are given as follows.
![]() : Modal participation factor on 1st mode
: Modal participation factor on 1st mode
![]()
![]() : Sway ratio
: Sway ratio
![]() : The number of building stories
: The number of building stories
![]() : Displacement rate of the
: Displacement rate of the
![]() -th floor on 1st mode, when the value of the building top is set to 1
-th floor on 1st mode, when the value of the building top is set to 1
![]() : Damping factor
: Damping factor
![]() : Vibration period of soil-structure interaction [s]
: Vibration period of soil-structure interaction [s]
![]() : Correction for increase of vibration period due to cracking on concrete (=2.0)
: Correction for increase of vibration period due to cracking on concrete (=2.0)
![]() : Correction for increase of vibration period due to sway and rocking motion
: Correction for increase of vibration period due to sway and rocking motion
![]()
![]() : Rocking ratio
: Rocking ratio
(3)Note
This method is applied to some earthquake damage assessments on the assumption that the product of
![]() by
by ![]() is nearly equal to 1 based on the result of the investigation by Nagashima et. al. (1989). By this assumption, the investigation of some parameters, which it is difficult to get, can be omitted.
is nearly equal to 1 based on the result of the investigation by Nagashima et. al. (1989). By this assumption, the investigation of some parameters, which it is difficult to get, can be omitted.
Japanese building construction code was greatly revised in 1971 and 1981. To consider the difference of the building strength by this revision,
![]() values shown in Table 4.2.3 and Table 4.2.4 are divided to some categories.
values shown in Table 4.2.3 and Table 4.2.4 are divided to some categories.
(4)Reference
Kanagawa Prefecture Office (1993) Kanagawa-ken seibu zisin higai soutei chousa houkokusho (in Japanese. Webmaster translates the title "Report of earthquake damage assessment in Kanagawa Prefecture").
Nagashima, I., T. Ugata, S. Kawamura and T. Okada (1989) Seismic capacity evaluation of buildings considering soil-structure interaction: Part3 Evaluation of seismic response of buildings, Summaries of technical papers of Annual Meeting Architectural Institute of Japan, 263-264 (in Japanese).
Nakano, O. and T. Okada (1989) Reliability analysis on seismic capacity of existing reinforced concrete buildings in Japan, J. Struct. Constr. Eng., AIJ, 406, 191-197(in Japanese with English abstract).
Tokyo Metropolitan Disaster Prevention Council (1991) Tokyo ni okeru chokka zisin no higai soutei ni kansuru chousa houkokusho, higai soutei shuhou hen (In Japanese. Webmaster translates the title "Study on assessment of earthquake damage in Tokyo, Volume for method description and countermeasure suggestion").
4.2.3.Kanagawa Prefecture Office (1985)(1)Input/Output
(2)Outline of the Method
The damage grade ratio of RC building can be derived from comparison of the strength of the building and external force by ground motion. The former is seismic performance of the building;![]() , and the latter is base shear coefficient;
, and the latter is base shear coefficient;![]() . The thresholds of damage grade are shown in Table 4.2.5.
. The thresholds of damage grade are shown in Table 4.2.5.
Table 4.2.5 Thresholds of damage grade (Kanagawa Prefecture Office, 1985)
|
Structural type |
Damage grade |
|
|
"Taiha" (heavy) |
"Chuha" (moderate) |
|
|
RC/SRC |
|
|
(RC: Reinforced Concrete, SRC: Steel-framed Reinforced Concrete)
Fig.4.2.3 Schematic illustration of damage grade judgment
The distributions of
![]() values are assumed to be log-normal distributions as shown in Fig.4.2.4 and Table 4.2.6, which are based on the investigation of
values are assumed to be log-normal distributions as shown in Fig.4.2.4 and Table 4.2.6, which are based on the investigation of
![]() values of 741 RC buildings in Kanagawa Prefecture, Shizuoka Prefecture and Tokyo Metropolitan area.
values of 741 RC buildings in Kanagawa Prefecture, Shizuoka Prefecture and Tokyo Metropolitan area.
Fig.4.2.4 Log-normal distributions of
![]() values of RC buildings according to the number of stories
values of RC buildings according to the number of stories
Table 4.2.6 Coefficients of log-normal distributions for
![]() values of RC buildings
values of RC buildings
|
The number of stories |
Coefficients |
|
|
Mean value |
Standard deviation |
|
|
1 |
1.15 |
0.6561 |
|
2 |
0.78 |
0.5529 |
|
3 |
0.56 |
0.4645 |
|
4-5 |
0.49 |
0.4250 |
Base shear coefficient is derived from the dynamic non-linear response analysis of origin-oriented tri-linear model of the non-wooden building with incident time-history waveform. The damping factor is 5% and natural period of non-wooden building is given as follows.
![]()
![]() : Natural period of non-wooden building [s]
: Natural period of non-wooden building [s]
![]() : The number of stories of non-wooden building
: The number of stories of non-wooden building
Since the seismic wave is transmitted to building not direct from ground surface, but from underground through foundation,
![]() value to use for damage grade judgment is reduced to 0.9 times. For the building with basement floor,
value to use for damage grade judgment is reduced to 0.9 times. For the building with basement floor,
![]() value is reduced to 0.8 times.
value is reduced to 0.8 times.
(3)Reference
Kanagawa Prefecture Office (1985) Kanagawa-ken zisin higai soutei chousa houkokusho, kenchikubutsu (in Japanese. Webmaster translates the title "Report of earthquake damage assessment about buildings in Kanagawa Prefecture").
4.2.4.Shiga and Yamakage (1994)(1)Input/Output
(2)Outline of the Method
The damage grade for RC buildings is estimated by comparing yield base shear coefficient to response base shear coefficient.
RC buildings are divided to some categories according to the construction age and the number of stories, and the distributions of yield base shear coefficients for each category are considered to be given as log-normal distributions as shown in Fig.4.2.5. The strength of buildings constructed after 1981 is considered to be stronger against ground motion than one of buildings constructed before 1981, because the building constructing code in Japan was revised in 1981. This is the reason of classification in terms of construction age in this method.
Fig.4.2.5 Distributions of yield base shear coefficients of RC buildings
![]()
The distributions of response base shear coefficients of RC buildings are considered to be log normal distributions with mean value(=![]() ) and variation coefficient(=0.40).
) and variation coefficient(=0.40).
![]() is given as follows.
is given as follows.
![]() : Peak response acceleration [gal]
: Peak response acceleration [gal]
![]() : Gravity acceleration [gal]
: Gravity acceleration [gal]
![]() : The number of building stories
: The number of building stories
![]() : Modal participation factor on 1st mode on
: Modal participation factor on 1st mode on
![]() -th floor
-th floor
![]()
Peak response acceleration is given as follows.
![]() : Peak ground acceleration [gal]
: Peak ground acceleration [gal]
![]() : Natural period [s]
: Natural period [s]
![]() : Correction for soil type
: Correction for soil type
Soil type 1 (Rock) : ![]()
Soil type 2 (Diluvium, mainly) : ![]()
Soil type 3 (Alluvium, mainly) : ![]()
Soil type 4 (Soft, especially) : ![]()
![]()
![]() : The number of building stories
: The number of building stories
![]() : Rate of increase of vibration period after cracking on concrete (=2.0)
: Rate of increase of vibration period after cracking on concrete (=2.0)
The damage grade ratio for RC building is estimated by comparing yield base shear coefficient
![]() to response base shear coefficient
to response base shear coefficient ![]() .
.
![]()
![]()
![]() : Ductility factor
: Ductility factor
Table 4.2.7 The value of ductility factor;
![]() used as the threshold of damage grade
used as the threshold of damage grade
|
Building group according to construction age |
Damage grade |
|
|
"Taiha" (heavy) |
"Chuha" (moderate) |
|
|
Designed by the code before 1981 |
1.50-1.75 |
1.25-1.50 |
|
Designed by the code reviced in 1981 |
2.00-2.50 |
1.50-2.00 |
As mentioned above, both of
![]() and
and
![]() are log normal distributions, and damage grade ratio;
are log normal distributions, and damage grade ratio;![]() is calculated by following relationship.
is calculated by following relationship.
![]() : Standard normal distribution
: Standard normal distribution
![]() : Mean of
: Mean of
![]()
![]() : Variation coefficient of
: Variation coefficient of
![]()
![]() : Mean of
: Mean of
![]()
![]() : Variation coefficient of
: Variation coefficient of
![]()
(3)Reference
Shiga, T. and S. Yamakage (1994) Prediction of earthquake damage to reinforced concrete building groups in urban areas, Proceedings of the ninth Japan earthquake engineering symposium, 2305-2310 (in Japanese with English abstract).