5. Assessment of building damage due to liquefaction
Liquefaction is induced by strong ground motion due to a large earthquake nearby mainly in alluvial plain, and destroys buildings, for example, by leaning and subsidence. In this chapter, we introduce some assessment methods of building damage due to liquefaction.
The liquefaction index (PL value) for the assessment of liquefaction potential is adopted in earthquake damage assessment by many local governments in Japan. The potential of liquefaction is connected with the liquefaction index (PL value) as follows.

: Liquefaction potential is quite low.

: Liquefaction potential is low.

: Liquefaction potential is high.

: Liquefaction potential is very high.
In the method introduced in this chapter, PL value is used as the index which is connected to the building damage due to liquefaction.
5.1.Taniguchi and Iida (1986)
(1)Input/Output
- Pre-condition
- Preparation of building distribution data
- Assessment of liquefaction potential
- Input Data
- Liquefaction index (PL value)
- JMA (Japan Meteorological Agency) Magnitude of the earthquake
- Earthquake type (inland or oceanic)
- Potential of lateral flow of ground due to liquefaction
- Footing type of wooden house (continuous footing with steel rod or not)
- Output Data
- The number of damaged wooden buildings due to liquefaction
(2)Outline of the Method
Taniguchi and Iida (1986) analyzed the records about damage by 1891 Nobi, 1944 Tonankai, 1945 Mikawa and 1983 Nihonkai-chubu earthquake, which were reported by local governments, and got following relationship for the assessment of wooden building damage ratio due to liquefaction.
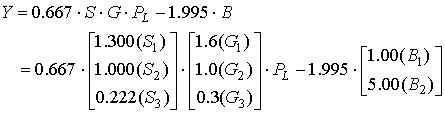
 : Wooden building damage ratio due to liquefaction in per cent
 : PL-value
 to
to  : Correction for the duration time of seismic waves (Table 5.1.1)
 to
to  : Correction for potential of lateral flow of ground due to liquefaction (Table 5.1.2)
 to
to  : Correction for footing type of wooden building (Table 5.1.3)
Table 5.1.1 Correction for the duration time of seismic waves,

|
Earthquake type |
|
Oceanic |
Inland |
|
JMA Magnitude |
7.5 or more |
 = 1.300 = 1.300
|
 = 1.000 = 1.000
|
|
7.0-7.4 |
 = 1.000 = 1.000
|
 = 0.222 = 0.222
|
|
6.9 or less |
= 0.222 |
= 0.222 |
Table 5.1.2 Correction for potential of lateral flow of ground due to liquefaction,

|
Potential of lateral flow of ground due to liquefaction |
Correction |
|
High
(There is a boundary with steep inclination between upper liquefied layer and lower non-liquefied layer.) |
 = 1.6 = 1.6
|
|
Low
(The ground instability by liquefaction in liquefied area is strongly heterogeneous.) |
 = 1.0
= 1.0
|
|
Nothing |
 = 0.3 = 0.3
|
Table 5.1.3 Correction for footing type of wooden building,

|
Footing type of wooden building |
Correction B |
|
Continuous footing with steel rod |
 = 1.0 = 1.0
|
|
Except the above |

= 5.0 |
(3)Note
It is very difficult to estimate the potential of lateral flow of ground due to liquefaction. Therefore, there are some applied cases where
 is assumed to be 1.0 among earthquake damage assessments in Japan.
There are two categories in terms of earthquake type about correction for the duration time of seismic waves as shown in Table 5.1.1. Around Japan, earthquakes which occur in oceanic region are mainly interplate earthquakes, and earthquakes in inland are mainly crustal earthquakes. So, the difference in earthquake type is expected to mean the difference in fault type in this method.
(4)Reference
Taniguchi, H. and K. Iida (1986) Damage estimation of wooden houses affected by liquefaction due to earthquake, Japan Archit. Plann. Environ. Eng., AIJ, 365, 108-118,
(in Japanese with English abstract).
5.2.Mochizuki and Enomoto (1989)
(1)Input/Output
Pre-condition
Prediction liquefied area
Preparation of building distribution data
Input Data
- Liquefied area
- Structural type of building
- The Number of building stories
- Foundation type of building
Output Data
- The number of damaged wooden buildings due to liquefaction
- The number of damaged non-wooden buildings due to liquefaction
(2)Outline of the Method
Wooden buildings
Mochizuki and Enomoto (1989) analyzed the records about wooden building damage by 1964 Niigata and 1983 Nihonkai-chubu earthquake, and got following wooden building damage ratio due to liquefaction.
Liquefied area:
The ratio of damage grade "Zenkai" is 10%
The ratio of damage grade "Hankai" is 20%
No damage
Non-Wooden buildings
Mochizuki and Enomoto (1989) analyzed the records about non-wooden building damage by 1964 Niigata earthquake, and got the assessment method of non-wooden building damage due to liquefaction on following assumptions.
a) 30 % of non-wooden buildings which are located in liquefied area are assumed to be affected by liquefaction
b) Among them, buildings with bearing pile foundation suffer no damage, buildings with friction pile foundation suffer damage of which grade is "Chuha", and buildings with spread foundation suffer damage of which grade is "Taiha".
Then Mochizuki and Enomoto (1989) investigated the foundation type for non-wooden buildings constructed from 1974 to 1987 in the downtown area of Tokyo Metropolitan area, and got the existence ratio as shown in Table 5.2.1 and Table 5.2.2.
From above, the number of non-wooden building damage for each damage grade can be derived from the number of existing non-wooden buildings and damage ratio for each category shown in Table 5.2.1 and Table 5.2.2.
Table 5.2.1 RC building damage ratio for each damage grade due to liquefaction
|
Foundation type |
The number of building stories |
Damage grade |
|
1-2 |
3 |
4-7 |
8 or more |
|
Bearing pile |
15 % |
60 % |
95 % |
100 % |
No damage |
|
Friction pile |
15 % |
20 % |
5 % |
0 % |
"Chuha" |
|
Spread foundation |
70 % |
20 % |
0 % |
0 % |
"Taiha" |
|
Total |
100% |
100% |
100% |
100% |
|
Table 5.2.2 Steel structure building damage ratio for each damage grade due to liquefaction
|
Foundation type |
The number of building stories |
Damage grade |
|
1-3 |
4-7 |
8 or more |
|
Bearing pile |
0 % |
30 % |
100 % |
No damage |
|
Friction pile |
10 % |
50 % |
0 % |
"Chuha" |
|
Spread foundation |
90 % |
20 % |
0 % |
"Taiha" |
|
Total |
100% |
100% |
100% |
|
(3)Note
This method was used on the assumption that the liquefied area was the area where calculated PL-value was more than 15 in many earthquake damage assessments of local government in Japan.
Because the ratios shown in Table 5.2.1 and Table 5.2.2 were derived from the investigation in specific area, they are not general-purpose. In order to apply this method to other areas, it is necessary to investigate the existence ratio for each non-wooden building foundation type.
(4)Reference
Mochizuki, T. and T. Enomoto (1989) Damage prediction methods for buildings and incidental facilities, Comprehensive Urban Studies, 38, 25-50 (in Japanese with English abstract).