| Kuril Tsunami on November 15, 2006 |
We have simulated the tsunami generated from the Kuril earthquake (46.577°N, 153.247°E, Mw=8.3 at 11:14:16 UTC according to USGS) on November 15, 2006. The assumed tsunami source covers the aftershock area during one day after the mainshock (Fig. 1). The fault size is 200 km × 100 km. Top depth of the fault is 5 km. The focal mechanism is strike=214º, dip angle =15º and slip angle= 92º from the Global CMT solution. Average slip on fault is 4 m. As the initial condition for tsunami, static deformation of the seafloor is calculated for a rectangular fault model [Okada, 1985] using the source model. The used bathymetry data is 2' grid interval resampled from General Bathymetric Chart of the Oceans (GEBCO) 1' grid data. To calculate tsunami propagation, the linear shallow-water, or long-wave, equations were numerically solved by finite-difference method [Satake, 1995]. The maximum heights of simulated tsunami indicate that the tsunami energy is concentrating to directions perpendicular to the strike of fault (Fig. 2).
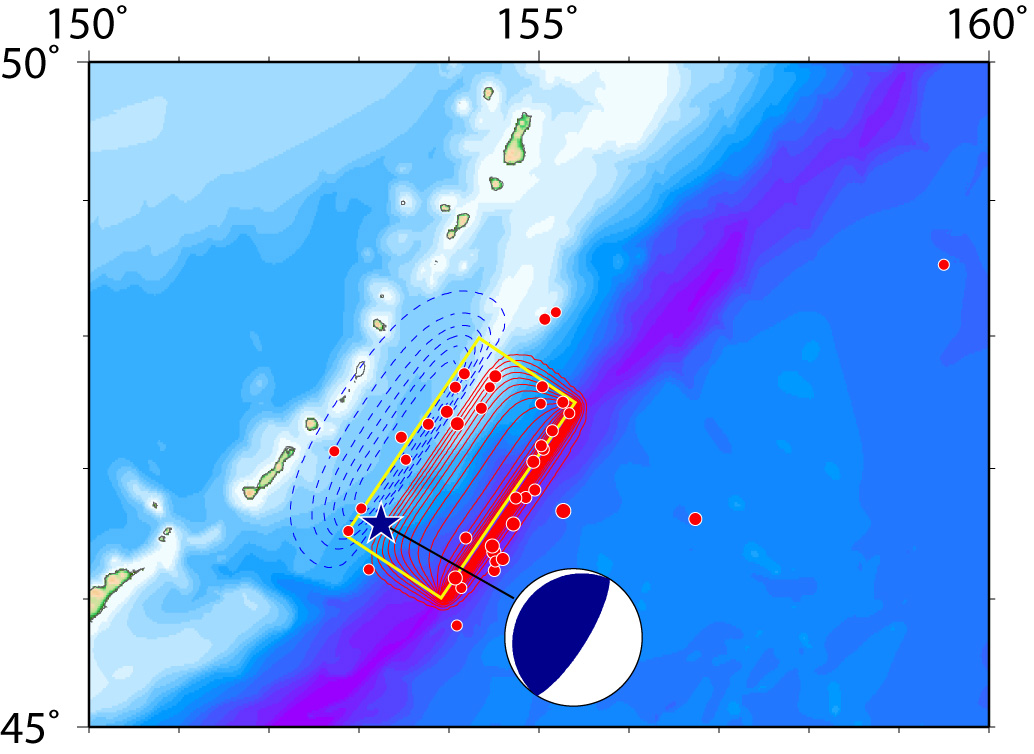
Fig.1 Tsunami Source Model
The red contours indicate uplift, while the blue contours indicate subsidence with the contour interval of 0.1 m.
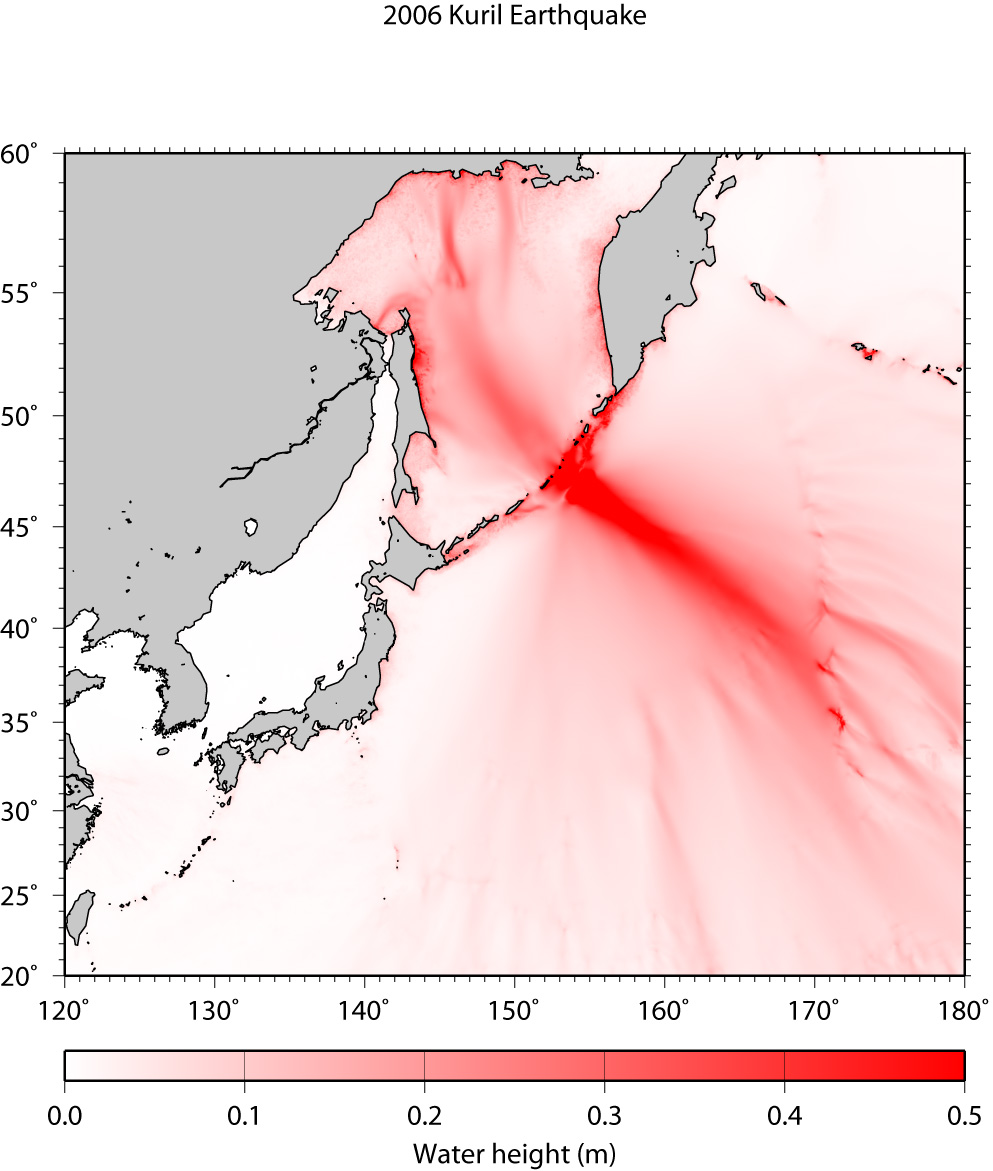
Fig.2 Maximum Height of Computed Tsunami
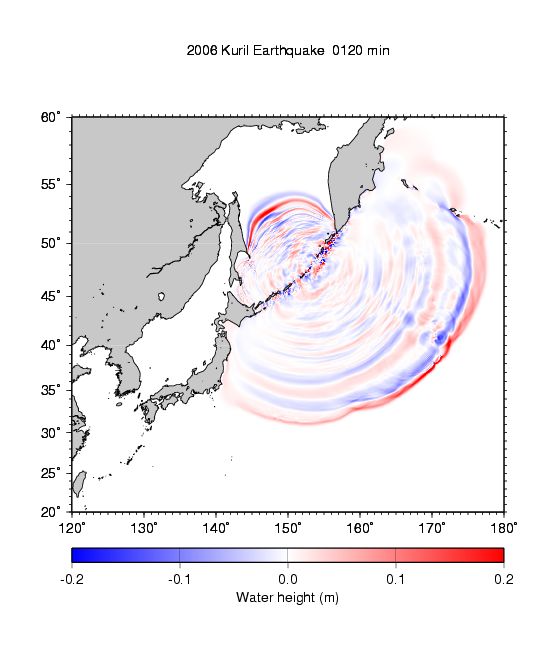
Fig.3 Tsunami Propagation (Click to start animation)
The red color means that the water surface is higher than normal sea level, while the blue means lower.
| by Yushiro Fujii (IISEE, BRI) and Kenji Satake (GSJ, AIST) |
|
|
| References |
|
Okada, Y. (1985), Surface Deformation Due to Shear and Tensile Faults in a Half-Space, Bull. Seismol. Soc. Am., 75, 1135-1154. Satake, K. (1995), Linear and Nonlinear Computations of the 1992 Nicaragua Earthquake Tsunami, Pure and Appl. Geophys., 144, 455-470. |
Last Updated on 2006/11/17