| Off Sendai Tsunami on December 7, 2012 |
We have simulated the tsunami generated from the earthquake off Sendai, Miyagi, Japan (37.889°N, 144.090°E, Mw = 7.3 at 08:18:24 UTC according to
USGS) on December 7, 2012.
The assumed tsunami source is based on the
Global CMT solutions of the earthquake doublets.
Event 1: The fault size is 40 km × 20 km. Top depth of the fault is 20 km. The focal mechanism is strike = 38º, dip angle = 51º and slip angle = 138º.
Event 2: The fault size is 40 km × 20 km. Top depth of the fault is 5 km. The focal mechanism is strike = 198º, dip angle = 50º and slip angle = -90º.
An average slip on fault is 2 m for each event. The each seismic moment is 8.0 x 10**19 Nm (Mw = 7.2) assuming the regidity of 5 x 10**10 N/m**2.
The total seismic moment is 1.6 x 10**20 Nm (Mw = 7.4) for the both events.
As the initial conditions for tsunami, static deformations of the seafloor are calculated for a rectangular fault model [Okada, 1985] using the source models (Fig. 1). The used bathymetry data is JTOPO30 with 30" grid interval. To calculate tsunami propagation, the linear shallow-water, or long-wave, equations were numerically solved by using a finite-difference method [Satake, 1995]. The maximum heights of simulated tsunami are shown with the calculated tsunami waveforms at GPS wave gauges and coastal tide gauges in Fig. 2. We can see the tsunami propagation to the east coast of Honshu, Japan (Fig. 3).
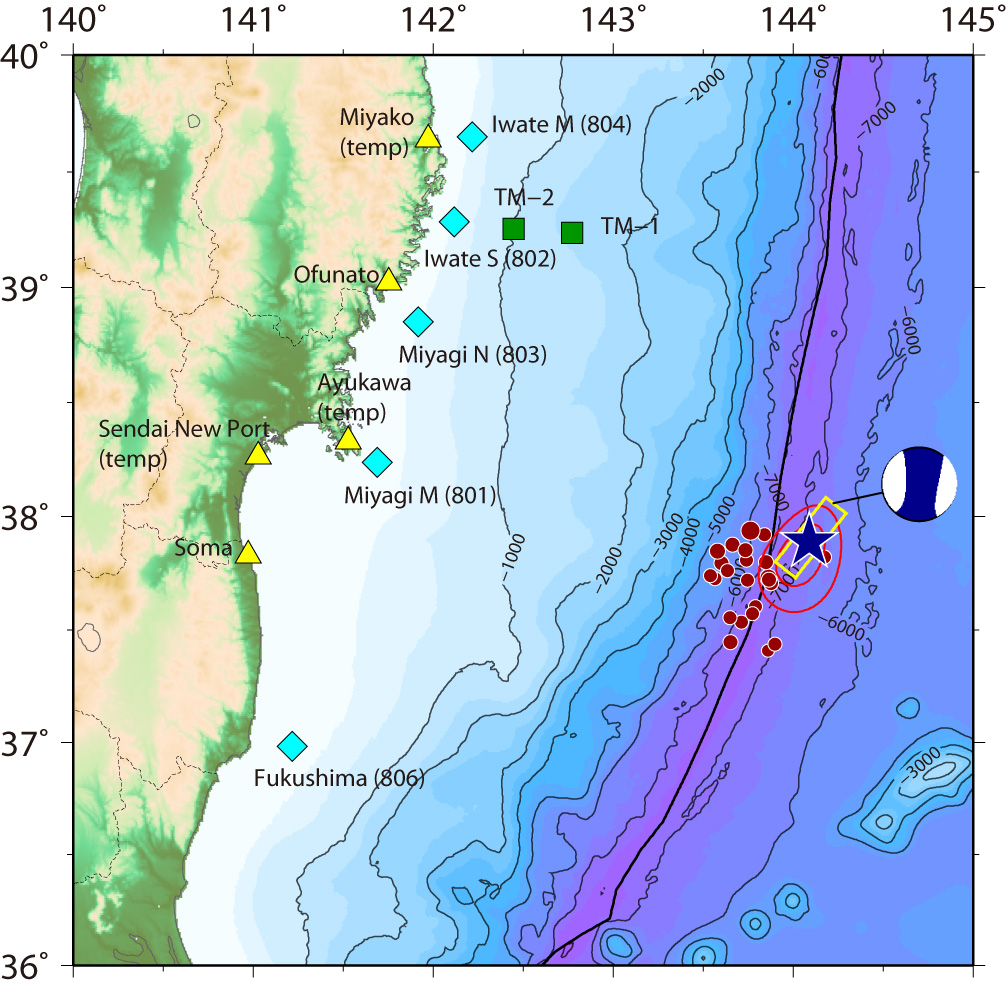
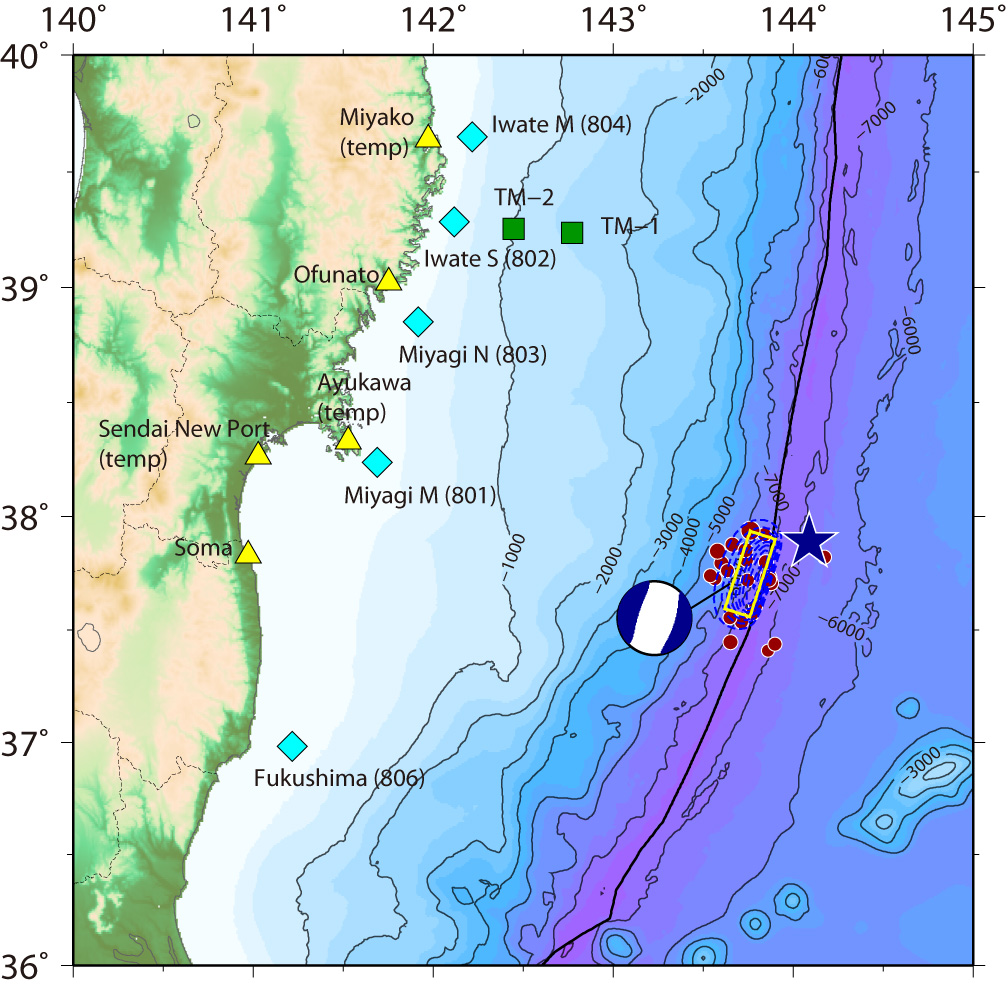
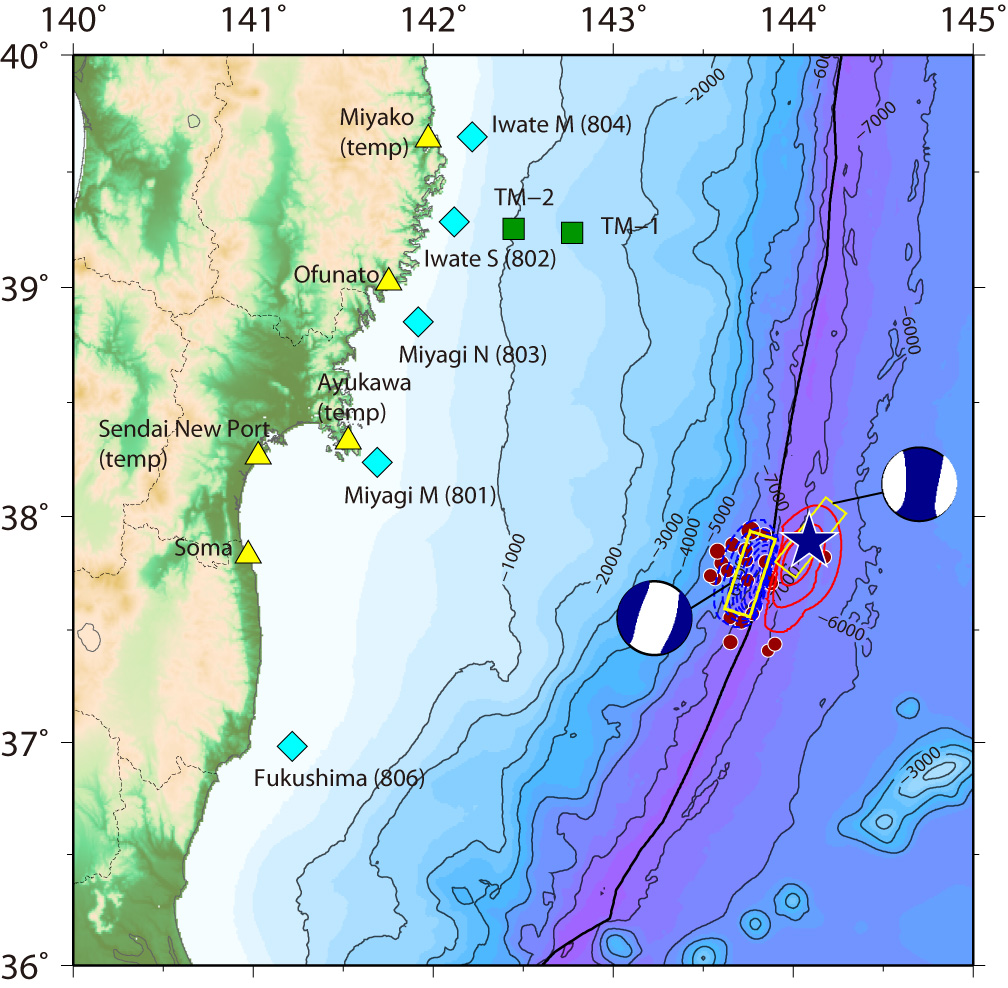
Fig.1 Tsunami Source Models for Event 1 (left), Event 2 (middle), and Events 1 and 2 (right).
The red contours indicate uplift, while the blue contours indicate subsidence with the contour interval of 0.1 m.
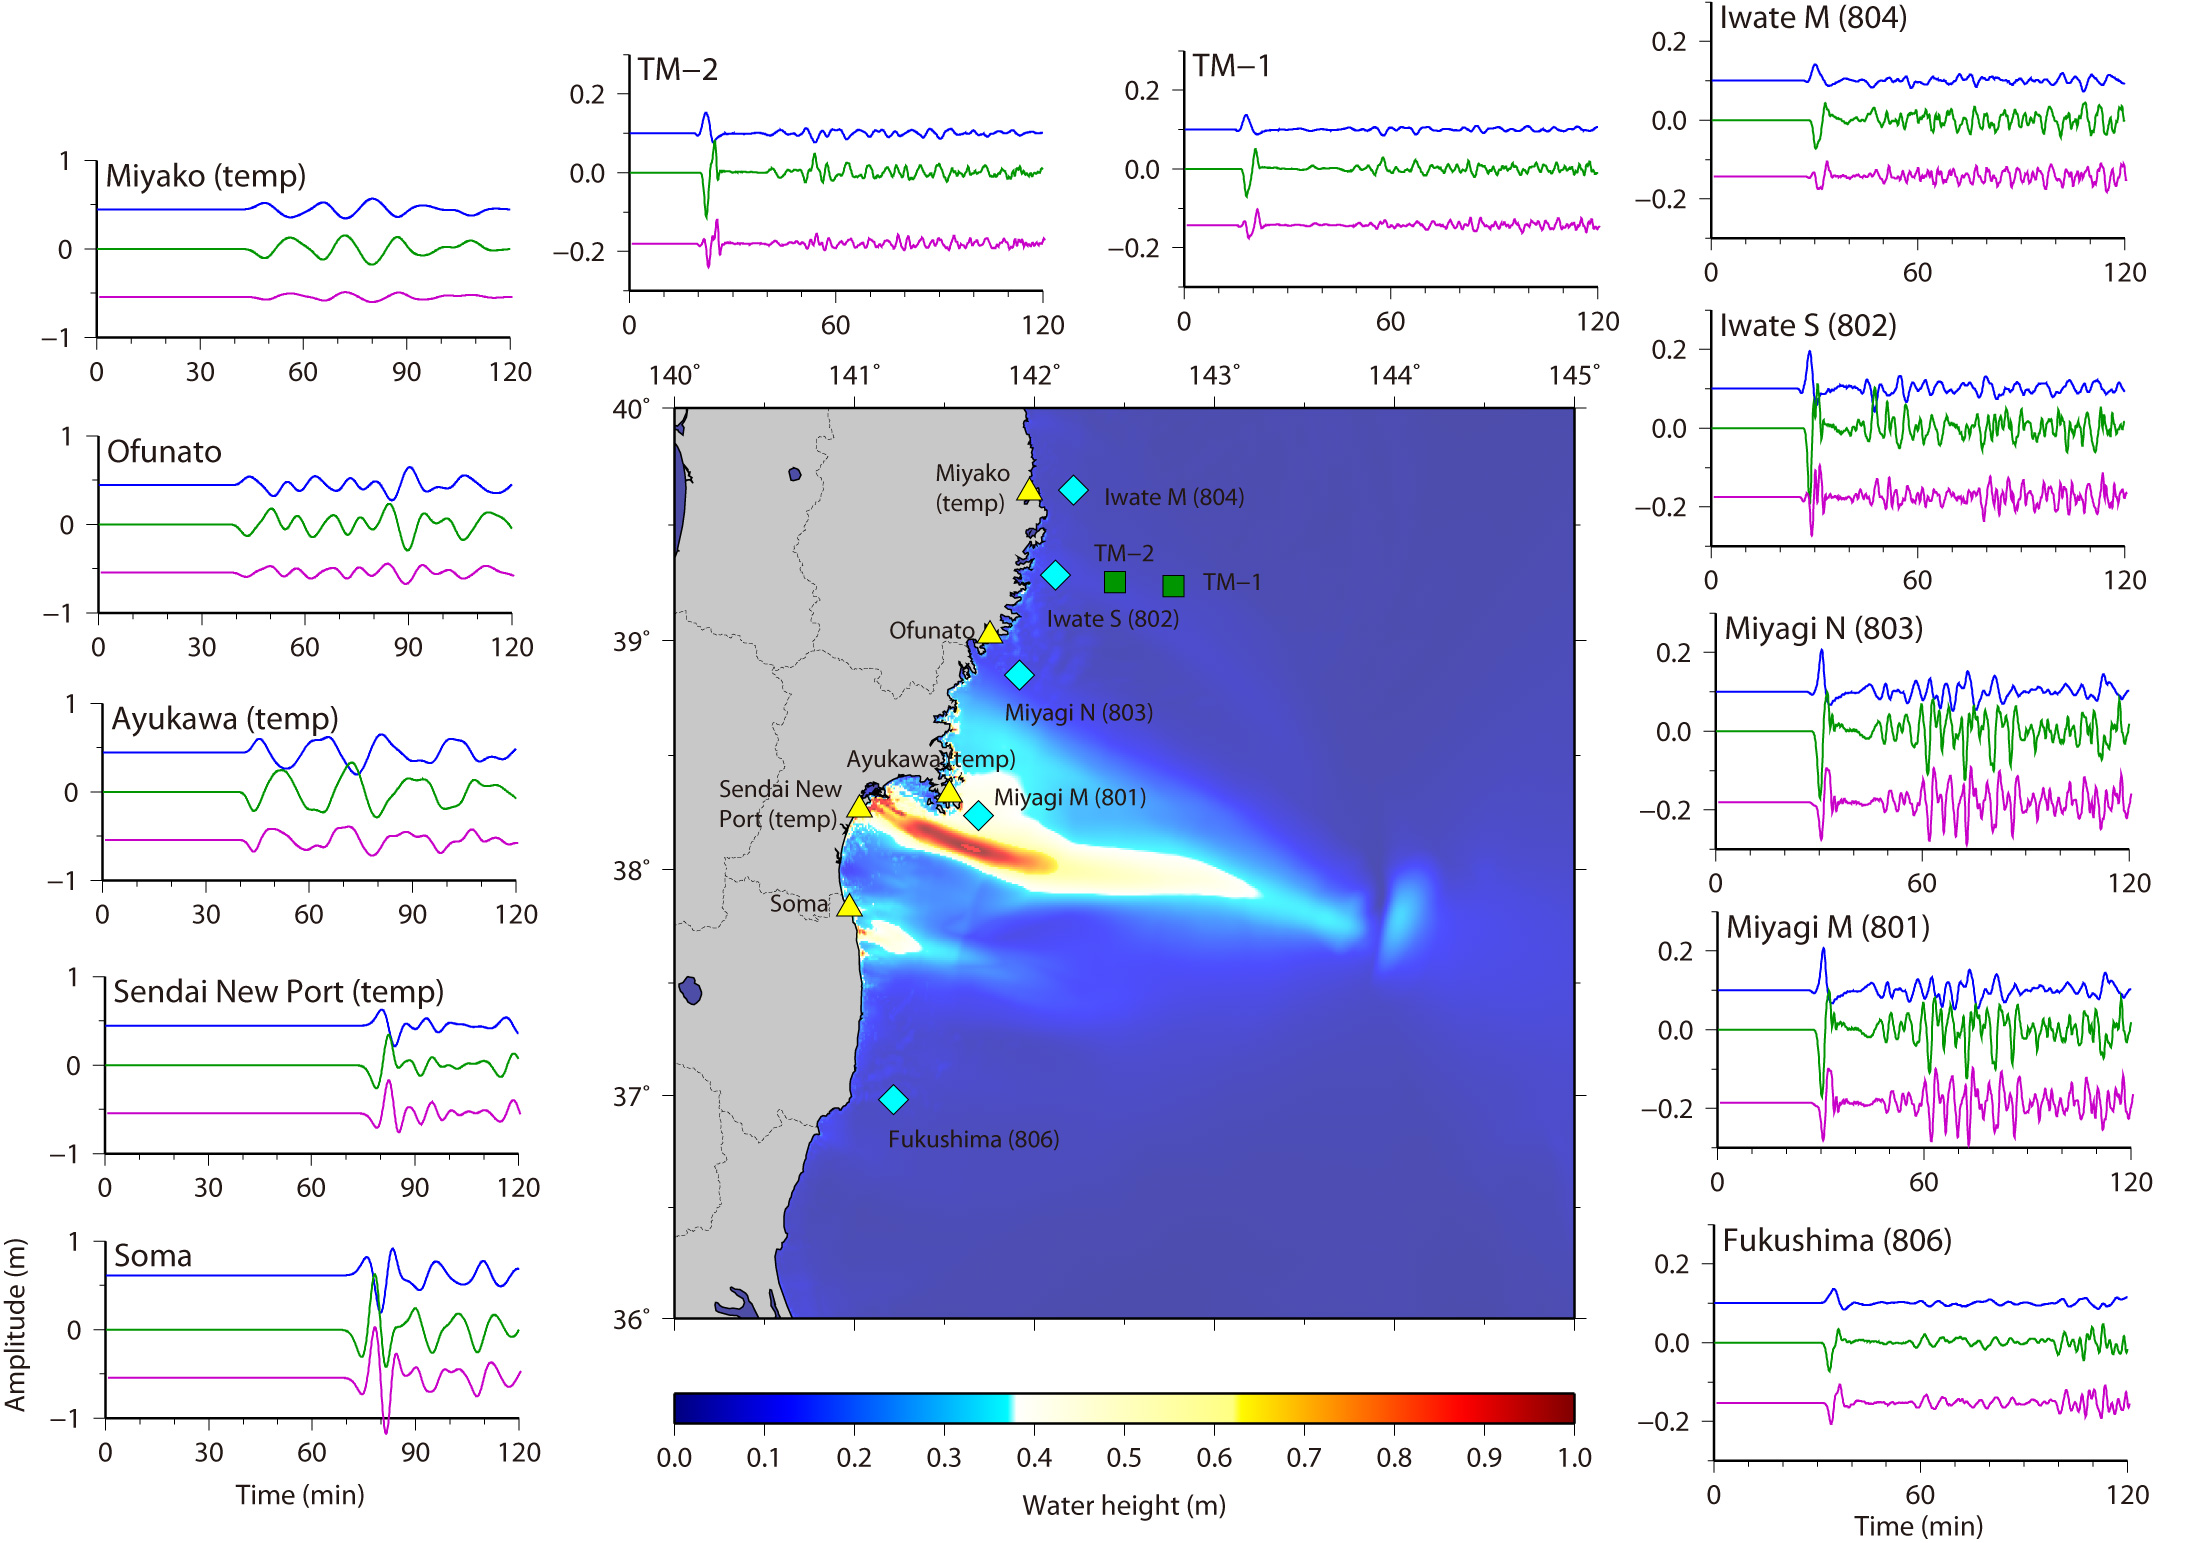
Fig.2 Maximum Height of Computed Tsunami and Tsunami Waveforms
Calculated tsunami waveforms are also shown by blue (top), green (middle) and purple (bottom) lines for the Event 1, Event 2 and the both Events, respectively.
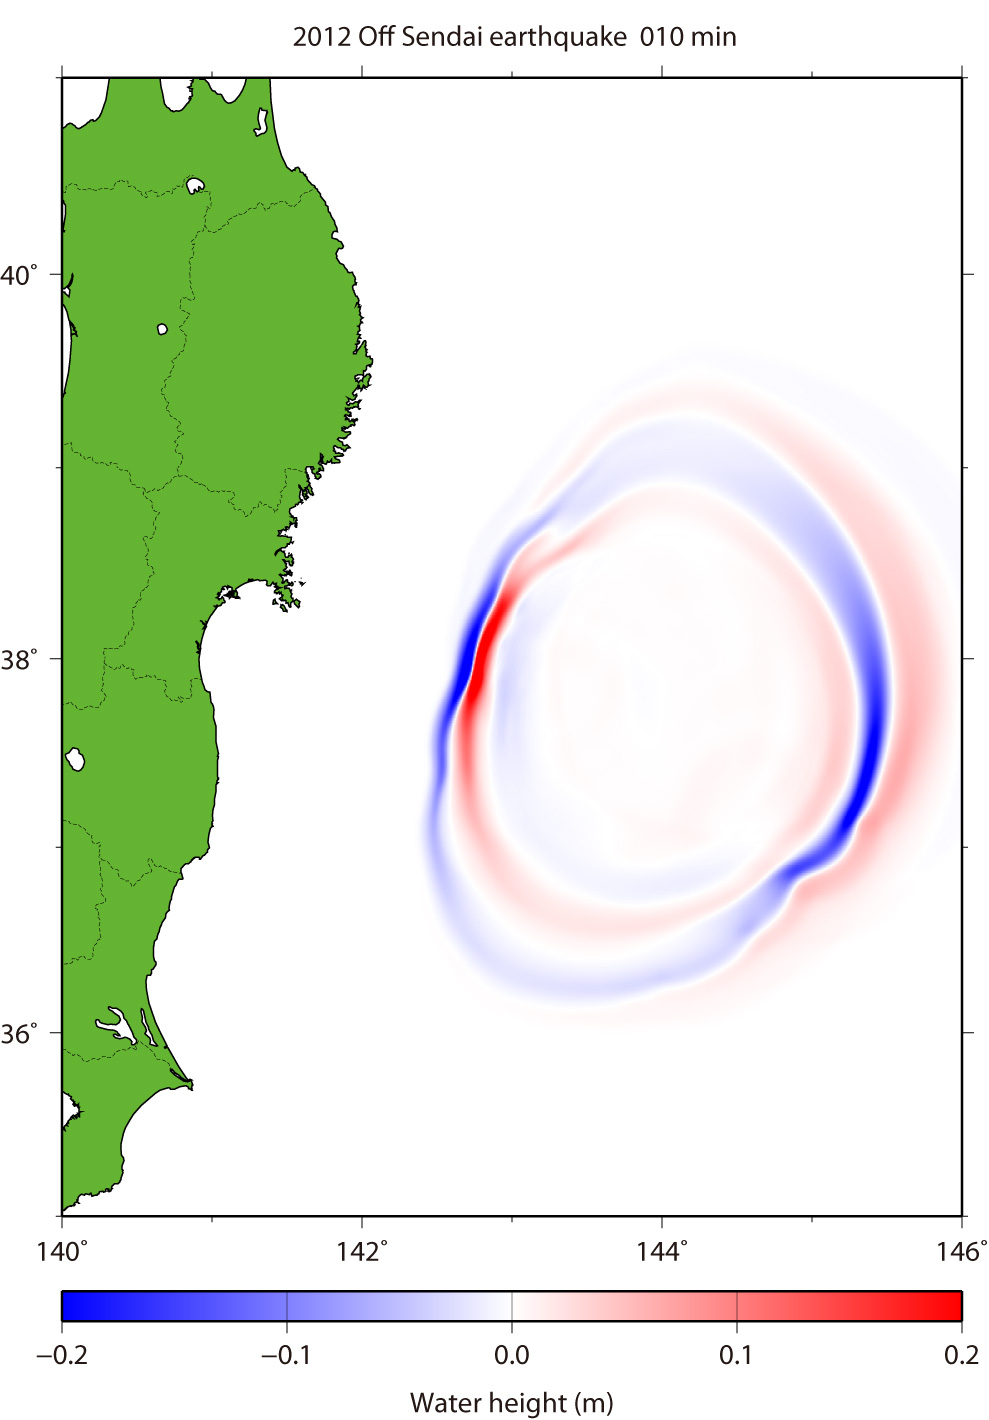
Fig.3 Tsunami Propagation (Click to start GIF animation) for Events 1 and 2.
The red color means that the water surface is higher than normal sea level, while the blue means lower.
| by Yushiro Fujii (IISEE, BRI) and Kenji Satake (ERI, Univ. Tokyo) |
|
|
| References |
|
Okada, Y. (1985), Surface Deformation Due to Shear and Tensile Faults in a Half-Space, Bull. Seismol. Soc. Am., 75, 1135-1154. Satake, K. (1995), Linear and Nonlinear Computations of the 1992 Nicaragua Earthquake Tsunami, Pure and Appl. Geophys., 144, 455-470. |
Last Updated on 2012/12/12