1. Empirical
attenuation formula for estimating PGA, PGV and response spectra
Many researchers have studied the attenuation characteristic of
strong ground motion for a long time. They proposed many empirical attenuation
formulas to estimate peak ground acceleration (PGA), peak ground velocity (PGV)
and response spectra. Several formulas are selected and shown in this page
according to the following criterion;
 Paper published year 2004-2005;
13th
World Conference on Earthquake Engineering
Journal
of Structural and Construction Engineering AIJ
Structure
Engineering Symposium
Journal
of the
Journal
of
Bulletin of the Seismological Society of
Earthquake
Spectra
Based on the observed record in wide area
Finally, 15
formulas which are summarized in Table 1.1 are selected and 10 items are
compiled.
1)
Reference
2)
Estimated
physical parameters
3)
Used
strong motion dada
4)
Style
of faulting
5)
Ground
condition
6)
Definition
of magnitude
7)
Definition
of source distance
8)
Definition
of horizontal components
9)
Applicability
written in this paper
10) Empirical attenuation formula
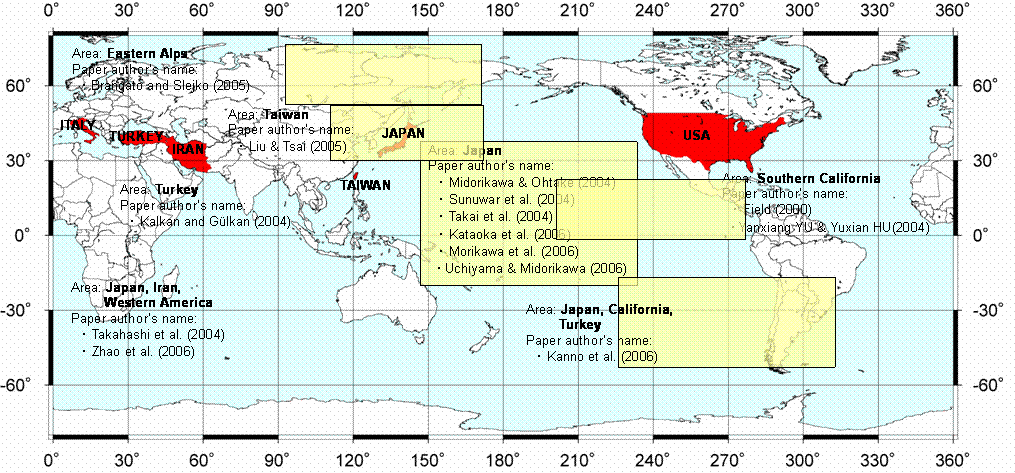
Figure 1-1 Object area of empirical attenuation
formula (red area)
Table 1-1 Summary of empirical attenuation formula
|
Author |
||||||||
|
Tectonic Environment |
|
Sallow crustal |
Shallow crustal |
Crustal Intra-plate Inter-plate |
|
Crustal Interface Slab |
Shallow crustal Intra-plate Inter-plate |
|
|
Style of Faulting |
- Strike-slip - Reverse-slip |
- Reverse - Strike-slip - - Unknown |
- Reverse - Strike-slip - - Unknown |
|
|
- Reverse - Strike-slip - - Unknown |
|
|
|
Ground Condition |
|
- Rock - Soil - Soft soil |
- Rock - Soil - Soft soil |
Stiff site (AVS30 is
about 600m/s) |
|
- Rock - Hard soil - Medium soil - Soft soil |
|
|
|
Other Effect |
|
|
|
|
|
|
|
|
|
Acceleration |
|
|
○ |
○ |
○ |
○ |
○ |
|
|
Velocity |
|
○ |
|
○ |
|
|
|
|
|
Sa (5%) |
○ (0.3, 1.0, 3.0sec) |
|
|
|
○ (0.05-3.00sec) |
○ (0.02-5.00sec) |
|
|
|
Sv (5%) |
|
|
|
|
|
|
|
|
|
Magnitude |
Mw |
Mw |
Mw |
Mw |
MJ |
Mw |
MJ |
|
|
Distance |
closest distance to the
vertical projection of rupture |
closest horizontal
distance |
closest horizontal
distance |
fault distance |
hypocentral distance |
source distance |
hypocentral distance |
|
|
Component |
H |
○ (average) |
|
○ |
○ (larger) |
○ (larger) |
○ (geometric mean) |
○ |
|
V |
|
○ |
|
|
○ |
|
|
|
|
Source Data |
1934-1994, 5.1<Mw<7.5, 28events, |
1976-2002, 4.5<Mw<7.4, 47events, 100records |
1976-2003, 4.0<Mw<7.4, 57events, 112records |
1968-2001, 5.5<M<8.3, depth3-120km, 33events, PGA 3335redords, PGV
1980redords |
1996 June -2003 December, 4.0<MJ<5.6, depth8-43km, 42events, acc.667records, |
Iran, Mw>5.0, depth<162km, 249events, 4192records, |
and 1997-2003, 5.0<MJ<8.0, depth8-122km, 65events |
|
|
Applicability |
|
closest horizontal
distance <200km Mw4.5-7.5, |
closest horizontal
distance <250km, Mw 4.0-7.5 |
|
eastern margin of |
depth <120km |
|
|
|
Author |
||||||
|
Tectonic Environment |
|
|
Crustal earthquake |
|
|
|
|
Style of Faulting |
|
|
|
|
|
|
|
Ground Condition |
Rock |
|
TWN area : whole CHY area : southwestern Taiwan IWA area : northeastern Taiwan NTO area : central |
|
|
|
|
Other Effect |
|
|
|
|
|
|
|
Acceleration |
○ |
○ |
○ |
○ |
|
|
|
Velocity |
|
○ |
○ |
○ |
|
|
|
Sa (5%) |
○ (0.04-20sec) |
○ (0.05-2sec) |
|
○ (0.05-5.00sec) |
|
|
|
Sv (5%) |
|
|
|
|
○(1%) (2-20sec) |
|
|
Magnitude |
ML |
ML |
Mw |
Mw |
Mw |
|
|
Distance |
epicentral distance |
epicentral distance or closest horizontal
distance to the vertical projection of the rupture |
hypocentral distance |
source distance |
source distance |
|
|
Component |
H |
○ |
○ |
○ |
○ |
○ |
|
V |
|
○ |
○ |
|
|
|
|
Source Data |
1991-2001, 5.0<M<7.5, 38events, 522records |
1976-2002, 2.5<ML<6.3, 240events, PVA 3168records, horizontal components
1402records |
1993-2002, 4.0<Mw<7.1, depth2.7-30km, 51events, three components >7900 |
Mw>5.5, 184events, 11542records, |
1964-2004, 6.9<Mw<8.2(Subduction), 5.8<Mw<6.9(Crustal), depth0-58.5km 21event, |
|
|
Applicability |
|
2.5<ML<6.3, 0<R<130km |
|
|
|
|
|
Author |
||||
|
Tectonic Environment |
Inter-plate Slab |
|
Crustal Interface Slab |
|
|
Style of Faulting |
|
|
- Reverse - Strike-slip - - Unknown |
|
|
Ground Condition |
|
Vs 500m/s (average over the upper
30m) |
- Rock - Hard soil - Medium soil - Soft soil |
|
|
Other Effect |
|
|
|
|
|
Acceleration |
○ |
|
○ |
|
|
Velocity |
○ |
|
|
|
|
Sa (5%) |
○ (0.05-0.45sec) |
○ (0.02-5.0sec) |
○ (0.05-5.00sec) |
|
|
Sv (5%) |
|
|
|
|
|
Magnitude |
Mw |
Mw |
Mw |
|
|
Distance |
source distance |
shortest distance to the
rupture surface |
source distance |
|
|
Component |
H |
|
○ (geometric mean) |
○ (geometric mean) |
|
V |
|
|
|
|
|
Source Data |
1996-2003, 5.5<Mw<8.0, depth30-150km, 35events |
1968-2003, 5.5<Mw<8.3 depth3-122km, 52events, 3198records |
-2003, depth 249events, 4518records, 20events, 208records |
|
|
Applicability |
correction coefficient for
empirical attenuation relations by Kanno et al.(2005). |
|
depth < 120km |
|