

|
 |
GESI_Program is a Microsoft Excel software with a Macro program mage by the Visual Basic. So, when you run the program, please validate the Macro program.
|
|
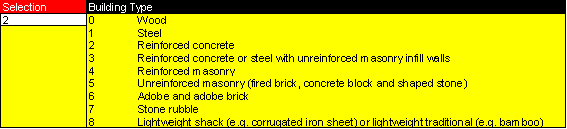
 STEP 1 [ Building Type ] STEP 1 [ Building Type ]
Select the number of building types from
the following chart.
|
|
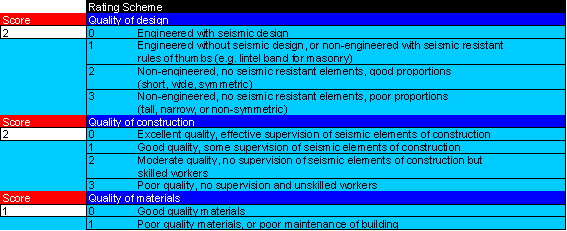
STEP 2 [ Quality of Building ]
Select the score of rating concerning 1)
quality of design, 2) quality of construction, and 3) quality of materials from
the following chart.
|
|
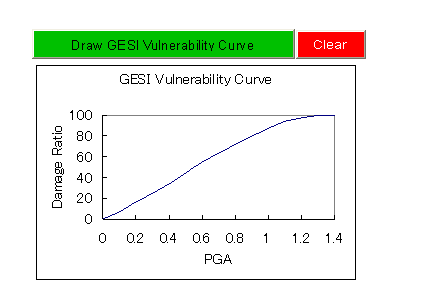
STEP 3 [ Vulnerability Curve ]
Push the button “Draw GESI Vulnerability
Curve”, then you will get the vulnerability curve of the building which
represents the relationship between the peak ground acceleration (PGA) and
damage ratio.
|
|
STEP 4 [ Input Earthquake Level ]
Type the peak ground acceleration (PGA) at
the site from the range (0.0-1.4G), where G is the gravity acceleration.

|
|
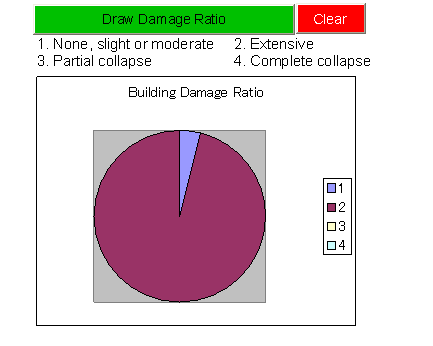
STEP 5 [ Damage Ratio ]
Push the button “Draw Damage Ratio”, then
you will get a graph which represents the ratio of the damage in four different
levels; 1) None, slight or moderate, 2) Extensive, 3) Partial collapse, and 4)
Complete collapse.
|
|
|