
As an index for the assessment of liquefaction potential, the liquefaction index (PL value) is adopted in earthquake damage assessment of many local governments in Japan. A liquefaction index is calculated from the safety rate to liquefaction (FL value) for every depth derived from drilling data, geology sections and conditions of geomorphological unit. The possibility of liquefaction and the safety rate to liquefaction (FL value) or a liquefaction index (PL value) are generally connected as follows.
FL > 1.0 -- There is little possibility of liquefaction in the depth.
FL <= 1.0 -- There is the possibility of liquefaction in the depth.
PL= 0 -- Liquefaction potential is quite low.
0<PL<= 5 -- Liquefaction potential is low.
5<PL<=15 -- Liquefaction potential is high.
15<PL -- Liquefaction potential is very high.
There are total upper load pressure and effective upper load pressure as an input parameter used by many of FL methods. They are calculated using the values of soil properties measured by drilling etc. Although detailed explanation of total upper load pressure and effective upper load pressure is omitted in each outline of method, it is generally expressed as follows.
Total upper pressure is expressed with the sum of effective upper total pressure and pore water pressure, and is given by the following formula.

Effective upper load pressure means the vertical pressure to the stratum of a certain depth, and is given by the following formula.
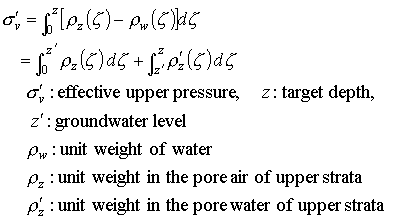
@
@
With the " Recommendations for design of building foundations" by Architectural Institute of Japan (1988), liquefaction potential is judged by the following methods.
The stratum made into the object of a liquefaction potential assessment is shown below.
@

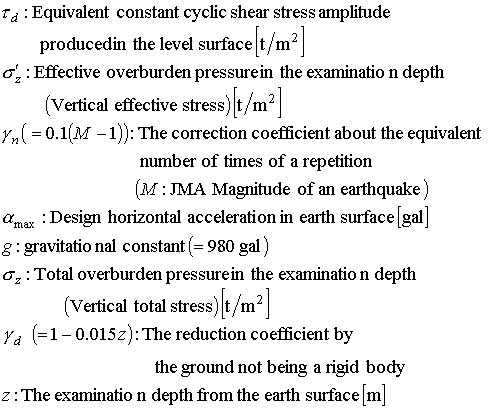
The amended N-value (![]() )
in a certain depth is calculated.
)
in a certain depth is calculated.
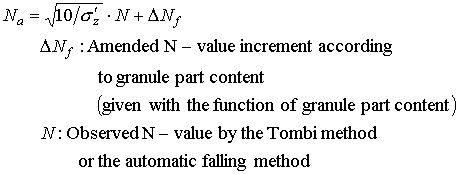
Using the prepared 5% shear strain
amplitude curve, the liquefaction resistance ratio ![]() of saturated soil corresponding to amended N-value is calculated.
of saturated soil corresponding to amended N-value is calculated.
Where Ñ1 is liquefaction resistance in the horizontal cross section diagram.
At the last, the rate FL of safety to liquefaction generating in every depth is calculated as follows.

(3)Reference
Architectural Institute of Japan (1988) Recommendations for design of building foundations (in Japanese).
@
2.1.2.Japan Road Association (1996)
Japan Road Association (1996) revised gSpecifications for Highway Bridgesh issued in 1990 based on the generating situation of liquefaction by the 1995 Southern Hyogo Prefecture Earthquake as follows.
Liquefaction potential is assessed
for following strata.
@
![]()
The seismic shear stress ratio ![]() is derived from following formula with peak ground acceleration.
is derived from following formula with peak ground acceleration.
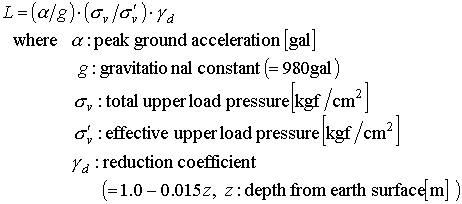
@The dynamic shear strength ratio ![]() of the stratum is calculated with cyclic triaxial strength ratio
of the stratum is calculated with cyclic triaxial strength ratio ![]() from following correction formula.
from following correction formula.
![]()
The coefficient ![]() is defined according to the property of seismic motion as follows.
is defined according to the property of seismic motion as follows.
a) Type 1: Seismic motion by great inter-plate earthquake with low occurrence frequency
Large amplitude acts for a long time repeatedly.
![]()
b) Type 2: Seismic motion by large inland earthquake with very low occurrence frequency

Cyclic triaxial strength ratio ![]() is defined experientially from following formula
is defined experientially from following formula

where ![]() is amended N-value in consideration of the influence of a grain size. In
the case of the reclaimed soil, 0.05 is subtracted from this formula.
is amended N-value in consideration of the influence of a grain size. In
the case of the reclaimed soil, 0.05 is subtracted from this formula.
Amended N-value of sandy soil is,
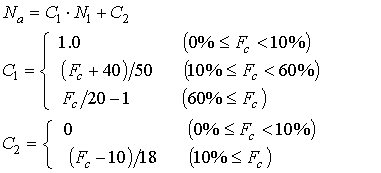
and that of gravelly soil is as follows.

In addition, normalized N-value (![]() )
for effective upper load pressure of 1kgf/cm2 is given below.
)
for effective upper load pressure of 1kgf/cm2 is given below.

(3)Reference
Japan Road Association (1996) Specifications for highway bridges: Part V seismic design.
@
@
The liquefaction potential of the ground is not assessed with FL method although it assesses the generating possibility of the liquefaction in a certain depth. Iwasaki et al. (1980) defined the value (a liquefaction index, PL value) acquired from the weighted integration of FL value for depth, and made it the index about liquefaction potential of the ground.

where ![]() is a weight function to the depth, and has given bigger weight to the shallow
portion.
is a weight function to the depth, and has given bigger weight to the shallow
portion.
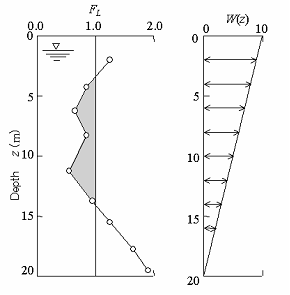
Fig.2.2.1 Example of FL value and weight
function ![]()
(3)Note
The result depends on the method that derives FL value.
(4)Reference
Iwasaki, T., F. Tatsuoka, K. Tokida, and S. Yasuda (1980) Estimation of degree of soil liquefaction during earthquakes, Soil Mechanics and Foundation Engineering, 28, 23-29 (in Japanese).
@
@
Liquefaction potential is assessed according to the flow shown in Fig.2.3.1.
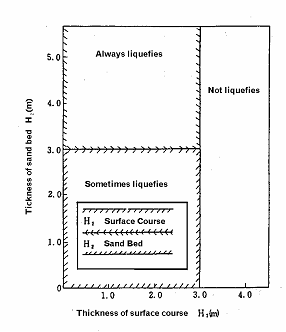
In the gAssessment by soil typeh, the soil is assessed as liquefiable when the sandy soil shown in Table 2.3.1 is included in the soil bed in the drilling data. In the gAssessment based on N-valueh, liquefaction potential is assessed as shown in Fig.2.3.1. The sand bed with bigger N-value than the critical N-value shown in the figure does not liquefy. The sand bed with smaller N-value than the critical N-value has liquefaction potential. In the gAssessment by soil structureh, the thickness of sand bed with smaller N-value than critical N-value (H2) and that of surface course (H1) are compared, and liquefaction potential is assessed according to the criteria shown in Fig.2.3.3.
@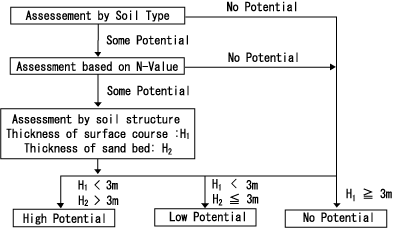
Fig.2.3.1 Liquefaction potential assessment
method
(Tokyo Metropolitan Disaster Conference,1991)
@
Table 2.3.1
The method of Liquefaction Potential Assessment
(Tokyo Metropolitan Disaster Conference,1991)
|
|
|
|
|
Sand, fine sand, medium sand, silty sand, sand with clay, sand with shell, sand with humus, sand with gravel |
|
|
Embankment*, landfill*, silt, loam, humus, sandy gravel, others |
*In the case that the soil is clearly loose sand bed and under the groundwater level, it was regarded as being easy to liquefy.
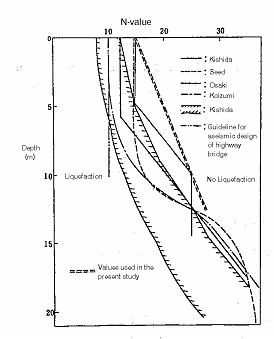 |
 |
|
|
and that of sand bed (Tokyo Metropolitan Disaster Conference, 1985) |
(3)Note
The target earthquake motion of this method is that of JMA (Japan Meteorological Agency) seismic intensity 6 and 250 gal of peak acceleration. Therefore, the case where the earthquake motion except JMA seismic intensity 6 is not taken into consideration.
For this reason, it should be noted that the liquefaction potential of every place point is assessed for the earthquake motion not of arbitrary earthquakes, but of JMA seismic intensity 6.
(4)Reference
Tokyo Metropolitan Disaster Conference (1985) Tama chiiki ni okeru zisin higai no soutei ni kansuru houkokusho (In Japanese. Webmaster translates the title gReport of earthquake damage assessment in Tama regionh).
Tokyo Metropolitan Disaster Conference (1991) Tokyo ni okeru chokka zisin no higai soutei ni kansuru chousa houkokusho (In Japanese. Webmaster translates the title gStudy on assessment of earthquake damage in Tokyoh).
Tokyo Metropolitan Disaster Conference (1991) Tokyo ni okeru chokka zisin no higai soutei ni kansuru chousa houkokusho, higai soutei shuhou hen (In Japanese. Webmaster translates the title gStudy on assessment of earthquake damage in Tokyo, Volume for method description and countermeasure suggestionh).
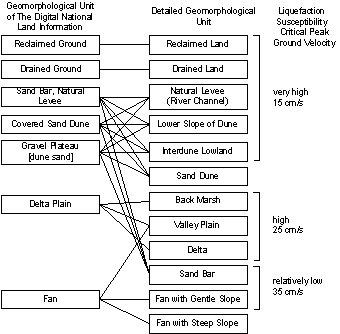
In the past earthquake case analysis, Matsuoka et al. (1993) found out that the liquefaction potential differed by each geomorphological unit. Furthermore, they searched for the standard peak ground velocity with which each geomorphological unit liquefies (Fig.2.3.4). The liquefaction potential is assessed easily from Fig.2.3.4 and Table 2.3.2 considering both of geomorphological classification map and the distribution of peak ground velocity of arbitrary earthquakes.
This method was verified according to the liquefaction in case of the 1987 Chiba-ken toho-oki earthquake.
@
Fig.2.3.4 Geomorphological Unit of the Digital National Land Information of Japan and Geomorphological Unit for Liquefaction Assessment (Matsuoka et al., 1993)
@
Table 2.3.2 Liquefaction Potential and Peak Ground Velocity (Matsuoka et al., 1993)
|
|
to Critical Peak Ground Velocity |
|
|
|
|
|
|
|
|
|
(3)Note
The relation between the liquefaction potential acquired by this method and PL value etc. is not clear.
The Digital National Information of Japan is the dataset including various digitized data about national land of Japan, e.g. land use, geomorphology, etc.
(4)Reference
Matsuoka, M., S. Midorikawa, and K. Wakamatsu (1993) Liquefaction potential mapping for large area using the digital national land information, Journal of Struct. Constr. Engng. AIJ., 452, 39-45 (in Japanese with English abstract).