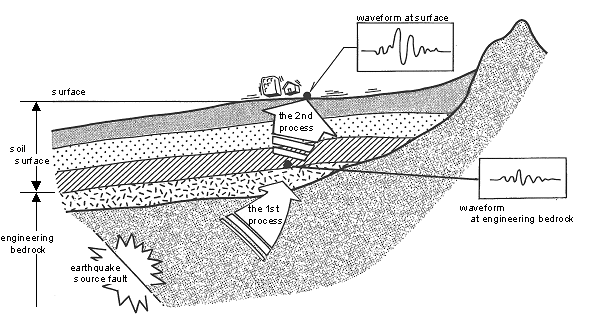
Fig.1.1 Schematic illustration of wave propagation through engineering bedrock and soil surface
The 1st Process: Wave propagation in engineering bedrock
The 2nd Process: Wave propagation in soil surface
Assessment of ground motion is the first step of earthquake damage assessment, and generally consists of two processes as shown in Fig.1.1. The first process is assessment of ground motion on engineering bedrock and the second process is assessment of site effects. When both processes are calculated, ground motion at surface can be evaluated. The first process is divided into two processes further in several assessments (e.g. Midorikawa and Kobayashi, 1979).

Fig.1.1 Schematic illustration of wave propagation through engineering bedrock and soil surface
The 1st Process: Wave propagation in engineering bedrock
The 2nd Process: Wave propagation in soil surface
On the first process as shown in Fig.1.1 ground motion on engineering bedrock is calculated for a hypothetical source. The method of this process is classified into two groups.
(a) The method that considers rupture
pattern of fault
(e.g. Midorikawa and Kobayashi, 1979,
1980)
(b) The attenuation formula for ground motion (e.g. Fukushima and Tanaka, 1990,1991)
In the group (a) hypothetical seismogenic fault is divided into subfaults, and rupture pattern is considered. Therefore, the method of this group explains the phenomenon that the observed waveform at the same distance from source are different each other according to rupture pattern. However, there is a problem that it has uncertainty on assumption of rupture direction for hypothetical earthquake that have never occurred.
In the group (b) the empirical relationship is derived from regression analysis for the observed data. This is an easy method to calculate ground motion and there are many attenuation formulas for each ground motion index such as peak acceleration, peak velocity, response spectrum and so on (e.g. Fukushima and Tanaka, 1990, 1991). Recently the observed data near source is used for regression analysis and the attenuation formula is revised to be adapted to calculation of ground motion near source region. There are some attenuation formulas that can consider rupture direction also. However the attenuation formula cannot fully explain the distribution of strong motion because the actual earthquake has complex rupture process.
In this method, fault plain is modeled to consist of small subfaults as shown in Fig.1.1.1(a), and seismic waves are radiated when rupture front arrives at each subfault.
The characteristic of this method is as follows:
1) Assessment of ground motion with velocity response envelope
2) Division of fault plain into small subfaults and think of subfault as point source
3) Considering S wave with period of approx. 0.1-5 sec.
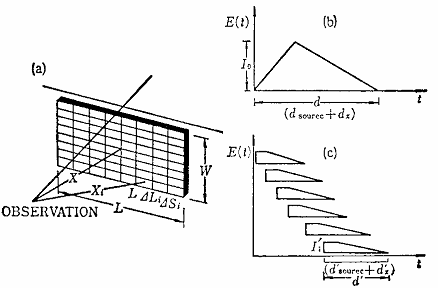
Fig.1.1.1 Schematic illustration of
ground motion assessment using response envelopes
(Midorikawa and Kobayashi, 1979)
(a) Dividing fault plain into small subfaults
(b) An approximate model of response envelope for ground motion
(c) Superposition of response envelopes from each subfault
Response envelopes from each subfault are illustrated as shown in Fig.1.1.1(c).
When the size and rupture velocity
of subfault are ![]() ,
, ![]() respectively, duration of response envelope is given by
respectively, duration of response envelope is given by
![]() .
.
Envelope has coda duration as a result of scattering effect on ray as follows:
![]()
where ![]() is proportional coefficient to express the time lag that is the difference
between arrival time of first arrived wave and arrival time of last arrived
wave from
is proportional coefficient to express the time lag that is the difference
between arrival time of first arrived wave and arrival time of last arrived
wave from ![]() th subfault.
th subfault. ![]() is
distance from subfault to observation.
is
distance from subfault to observation.
Peak amplitude ![]() for each response envelope from subfault is given by
for each response envelope from subfault is given by
 .
.
Total response envelope at observation
is calculated by superposition of response envelopes from each subfault
in consideration of travel time and delay time by rupture propagation.
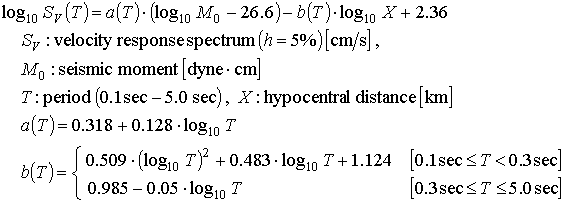
Velocity response ![]() is given
by attenuation formula for velocity response spectrum
is given
by attenuation formula for velocity response spectrum ![]() as follows:
as follows:
Duration ![]() is given as
is given as
![]() ,
,
where ![]() is earthquake magnitude.
is earthquake magnitude.
In this method calculation output is
velocity response spectrum. According to Kawasaki City Office (1988) peak
acceleration ![]() and peak
velocity
and peak
velocity ![]() are given as
are given as
![]()
![]() .
.
![]()
(3)Note
This method provides velocity response spectrum with damping factor of 5% on seismic bedrock where S-wave velocity is approx. 3 km/s. Therefore, if the ground motion on engineering bedrock is needed, usually the propagation process from upper boundary of seismic bedrock and engineering bedrock is calculated by multiple reflection theory of elastic response.
Analyzed data in this method do not contain record observed near source region and the shortest distance between source and observation is no less than approximate 50km. Therefore this method does not guarantee ground motion near fault.
In order to solve this problem, other attenuation formula for response spectrum is used. For example, Miyagi Prefecture Office (1996) uses the following formula that is calibrated by the recorded data for the 1995 Southern Hyogo Prefecture Earthquake.
![]()
(4)Reference
Kawasaki City Office (1988) Kawasaki-shi zisin higai soutei chousa houkokusho (in Japanese. Webmaster translates the title “Report of earthquake damage assessment in Kawasaki City”).
Midorikawa, S. and H. Kobayashi (1979) On estimation of strong earthquake motions with regard to fault rupture, Trans. of A.I.J., 282, 71-81 (in Japanese with English abstract).
Miyagi Prefecture Office (1996) Heisei-7-nen
Miyagi-ken zisin higai soutei chousa gyoumu houkokusho (in Japanese. Webmaster
translates the title “Report of earthquake damage assessment in Miyagi
Prefecture”).
1.1.2.Sugito and Kameda (1985)
Sugito and Kameda (1985) proposed the prediction models for nonstationary strong motion of moderate and great earthquakes on the basis of recorded ground motions on rock surface with the shear wave velocity of Vs =600-700 m/s. This model consists of two parts ; EMP-IB and EMP-IIB. EMP-IB is a calculation model for peak ground motions, response spectra, and nonstationary earthquake motions as a function of magnitude and epicentral distance. EMP-IIB is a calculation model for great earthquakes, which can simulate rock ground motions as a function of seismic moment, area and rupture pattern of fault, and rupture velocity.
Earthquake acceleration ![]() with nonstationary frequency content can be represented by
with nonstationary frequency content can be represented by

The following time-varying function
is adopted for the model of ![]() .
.

Three parameters in the above equation are modeled on the basis of the observed evolutionary power spectra.
Based on the 91 components of modified rock surface motion explained above, Sugito and Kameda (1985) proposed the earthquake motion calculation model for given earthquake magnitude and epicentral distance with the least square method, as follows.

Fig. 1.1.2 shows modified coefficients for model parameters dependent on frequency that can be applied near source region.
Therefore nonstationary earthquake motions can be obtained with magnitude, epicentral distance and random number.
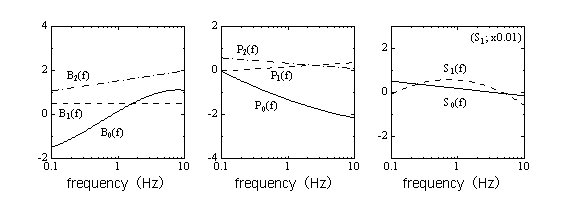
Fig.1.1.2 Modified coefficients for
model parameters (EMP-IB model)
[Sugito and Kameda (1985)]
EMP-IIB is a strong motion prediction model on the rock surface
for great earthquakes by superposition of evolutionary power spectra from
small earthquake events. A fault is divided into a number of small unit
events which correspond to the unit event of magnitude M=6.0 in EMP-IB.
In this extended model, the arriving time lag resulted from rupture on
the fault and difference of propagation distance of ground motions for
each individual unit event are considered. Consequently, the evolutionary
power spectra for great earthquakes are given from the superposition of
those from each unit event on the time domain. ![]() ,
which is rise up time of the evolutionary power spectrum, is as follows.
,
which is rise up time of the evolutionary power spectrum, is as follows.
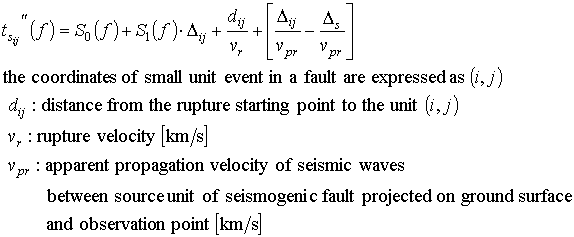
Then, ![]() ,
which is evolutionary power spectrum of great event, is superposed
,
which is evolutionary power spectrum of great event, is superposed ![]() ,
which is the evolutionary power spectra of each small unit event, considering
the arrival time lag of each unit event.
,
which is the evolutionary power spectra of each small unit event, considering
the arrival time lag of each unit event.


The parameter ![]() represents the number of small unit events on a specific great fault. The
following relation between the parameter
represents the number of small unit events on a specific great fault. The
following relation between the parameter ![]() and the seismic moment
and the seismic moment ![]() has been obtained from acceleration time history datasets, statistically.
has been obtained from acceleration time history datasets, statistically. ![]() is generally not an integral number.
is generally not an integral number.
![]()
The correction factor ![]() is incorporated for superposing of each frequency component, since the
number of superposing of evolutionary spectra depends on the frequency.
is incorporated for superposing of each frequency component, since the
number of superposing of evolutionary spectra depends on the frequency.

![]() and
and ![]() , which are integral
numbers used instead of
, which are integral
numbers used instead of ![]() ,
represent the number of unit event in the direction of fault width and
length. Consequently,
,
represent the number of unit event in the direction of fault width and
length. Consequently, ![]() is to adjust the result for correct scale.
is to adjust the result for correct scale.
Nonstationary wave form of acceleration
time history; ![]() is calculated
by following formula using
is calculated
by following formula using![]() .
.

In this method, engineering bedrock corresponds to the layer where S-wave velocity is the range from 600m/s to 700m/s.
(4)Reference
Sugito, M. and H. Kameda (1985) Prediction
of nonstationary earthquake motion on rock surface, Proc. of Japan Society
of Civil Engineers, SE/EE, Vol. 2, No. 2, 149-159.
The fault plane of the large event
is divided into ![]() subfaults
(Fig.1.1.3). The subfault size is taken to match the fault size of a small
event used as empirical Green’s function. The synthetic seismogram
subfaults
(Fig.1.1.3). The subfault size is taken to match the fault size of a small
event used as empirical Green’s function. The synthetic seismogram ![]() for the large event is given using the small event record
for the large event is given using the small event record ![]() as
as


![]()
![]()
c = △σT/△σE
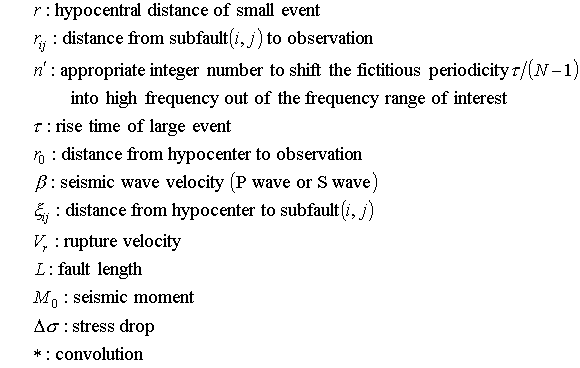
where ![]() and
and ![]() indicate large event
and small event, respectively.
indicate large event
and small event, respectively.
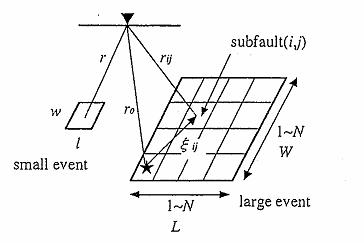
Fig.1.1.3 Schematic illustration of
the fault areas of the mainshock and a small event
(Miyake et al., 1999)
(3)Note
To assess ground motion by this method, it is necessary that observed waveform for small event that occurs near hypothetical source is recorded. But it is rare that necessary waveform was recorded. In this case, Green’s function must be obtained by using numerical calculation or statistical technique.
For example, there is Somerville (1993) technique as deterministic method. In that method, Green’s function is assessed by use of ray tracing method and source time function calculated from observed data.
Although this method calculates the ground motion at surface, it is used as a calculation method for the ground motion on engineering bedrock in earthquake damage assessment.
(4)Reference
Irikura, K. (1986) Prediction of strong acceleration motion using empirical Green’s function, Proc. 7 th Japan Earthq. Engnrg. Sympo., 151-156.
Irikura, K. (1988) Estimation of near-field ground motion using empirical Green's function, Proc. of Ninth World Conference on Earthquake Engineering, Tokyo-Kyoto, JAPAN, 8, 37-42.
Miyake, H, T. Iwata and K. Irikura (1999) Strong ground motion simulation and source modeling of the Kagoshima-ken Hokuseibu Earthquakes of March 26 (MJMA 6.5) and May 13 (MJMA 6.3), 1997, using empirical Green’s function method, Zisin, 51, 431-442 (in Japanese with English abstract).
Somerville, P. (1993) Engineering applications of strong ground motion simulation, Tectonophysics, 218, 195-219.
Goto et al. (1996) computes peak ground acceleration on seismic bedrock by multiplying acceleration that is obtained by attenuation formula (Joyner and Boore, 1981) and coefficient of directivity effect corresponding to rupture pattern together.
When directivity effect is not considered, horizontal peak ground acceleration on seismic bedrock can be calculated by attenuation formula of Joyner and Boore (1981) as follows:

where ![]() is peak ground acceleration in gal,
is peak ground acceleration in gal, ![]() is the closest distance to the fault rupture in km and
is the closest distance to the fault rupture in km and ![]() is moment magnitude.
is moment magnitude.
In this case rupture propagates along fault line toward both
ends from hypocenter that is located center of the fault line. Then peek
ground acceleration is given by
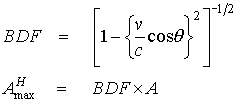

In this case rupture propagates along fault line toward the end
from hypocenter that is located another end of the fault line. Then peak
ground acceleration is given by


Azimuth is the angle that is measured
clockwise from the direction of rupture propagation to the direction of
observation (as shown in Fig.1.1.4), and ![]() is 0.72 that is given as average value.
is 0.72 that is given as average value.
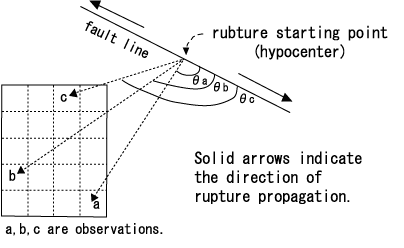
Fig.1.1.4 Image figure in case of bilateral faulting (Kyoto City Office, 1997)
Joyner and Boore already modified their attenuation formula from Joyner and Boore (1981).
(4)Reference
Goto, Y., J. Ejiri and K. Toki (1996) Directivity kouka wo kouryo shita nairiku katsu dansou ni yoru saidai chidou no hyoukahou, Proceedings of the 31st Japan National Conference on Geotechnical Engineering, 1117-1118 (in Japanese. Webmaster translates the title “Assessment method for peak ground motion induced by inland active fault considering directivity effect”).
Joyner, W. B. and D. M. Boore (1981) Peak horizontal acceleration and velocity from strong-motion records including records from the 1979 Imperial Valley, California, earthquake, Bull. Seism. Soc. Am., 71, 2011-2038.
Kyoto City Office (1997) Kyoto-shi zisin higai soutei (in Japanese. Webmaster translates the title “Report of earthquake damage assessment in Kyoto City”).
1.1.5.Fukushima and Tanaka (1990, 1991)
Fukushima and Tanaka (1990, 1991) proposes the attenuation formula of peak ground acceleration, which is derived from ground motion data recorded in Japan, the United States and so on. This attenuation formula showed the good agreement also with observed data for the 1995 Southern Hyogo Prefecture Earthquake.

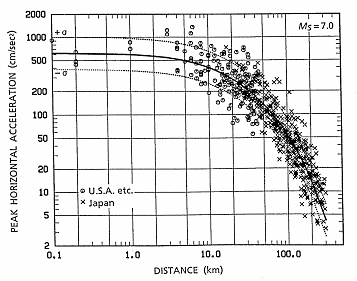
Fig.1.1.5 Analyzed data and attenuation
relation for peak horizontal acceleration
(Fukushima and Tanaka, 1991)
(3)Note
Since this formula calculates peak acceleration at the surface, correction is required when this formula is applied to estimating ground motion on engineering bedrock. For example, it is possible to evaluate it by multiplying the peak ground motion that is calculated by above equation and the soil parameter together, which is described at the original paper.
(4)Reference
Fukushima, Y. and T. Tanaka (1990) A new attenuation relation for peak horizontal acceleration of strong earthquake ground motion in Japan, Bull. Seism. Soc. Am., 84, 757-783.
Fukushima, Y. and T. Tanaka (1991) A new attenuation relation for peak horizontal acceleration of strong earthquake ground motion in Japan, Shimizu Technical Research Bulletin, 10, 1-11.
This method provides peak ground motion on engineering bedrock in which S-wave velocity is the range from 300m/s to 600m/s. Compared with other attenuation formulas, the characteristic of this method is that the focal depth is taken into consideration.

The regression coefficients of ![]() are summarized in Table 1.1.1.
are summarized in Table 1.1.1.
Table 1.1.1 Regression coefficients (Annaka et al., 1997)
|
|
|
|
|
|
|
|
|
|
|
1.730
|
|
|
|
|
|
-0.519
|
(3)Note
In this method, engineering bedrock corresponds to the layer where S-wave velocity is the range from 300m/s to 600m/s.
(4)Reference
Annaka, T., F. Yamazaki and F. Katahira (1997) Kishou-chou-87-gata kyoushinkei kiroku wo mochiita saidai chidou oyobi outou-spectrum suitei shiki no teian, Proceedings of the 24th JSCE Earthquake Engineering Symposium, 161-164 (in Japanese. Webmaster translates the title “Proposal of the attenuation equation of peak ground motion and response spectrum using JMA-87 type accelerogram”).
Since it is said that there is a high correlation between earthquake damage and peak ground velocity, in Midorikawa (1993) method, peak ground velocity is used as a measure for ground motion severity. This method provides peak ground velocity on stiff site with S-wave velocity of 600m/s.

![]()
![]()
![]()
(3)Note
According to the magnitude range of analyzed data, it is valid to use this formula for earthquakes with moment magnitude of 6.5 to 7.8
(4)Reference
Midorikawa, S. (1993) Preliminary analysis for attenuation of peak ground velocity on stiff site, Proceedings of the International Workshop on Strong Motion Data, Vol. 2, 39-48.
1.2.Assessment of Local Site Effects
To assess local site effects, the following methods are generally used as response analysis of soil surface in earthquake damage assessment.
(a) Multiple Reflection theory of Elastic Response
(b) Equivalent Linear Approach of Non-linear Response
(c) Other methods(e.g. Matsuoka and Midorikawa, 1994)
Multiple reflection theory of elastic response is basic method in response analysis, and built in early 1960s (e.g. Haskell, 1960). This method can explain that ground motion tends to be amplified at soft-soil site. However if incident wave has large amplitude, ground motion at soft-soil site is actually weaker than at stiff site. This phenomenon is called non-linear behavior of soil and observed when large earthquake occurred, but multiple reflection theory of elastic response cannot explain this phenomenon.
In order to take non-linear behavior into consideration, equivalent linear approach of non-linear response was developed. In earthquake damage assessment, SHAKE (Schnabel et al., 1972) has been often used as equivalent linear approach of non-linear response, but recently the method which can consider frequency-dependent effect of shear modulus and damping factor, e.g. FDEL (Sugito et al., 1994), is used more and more.
On the other hand there are simple methods for evaluating site amplification factor. For example, Matsuoka and Midorikawa (1994) can calculate site amplification factor from geomorphological unit or geology, altitude and the shortest distance from a river. The advantage of this method is that it does not need detailed parameters about soil, which is obtained from field investigation such as drilling data. On the other hand, the disadvantage is that it cannot explain non-linear behavior of soil.
As shown in Fig.1.2.1, soil surface is modeled as the horizontal layered media.
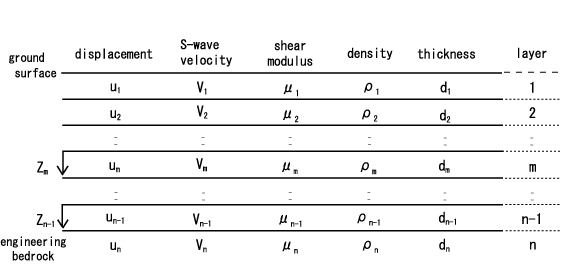
Fig.1.2.1 Soil model with horizontal layered structure
Displacement amplitude of incident
S wave at upper boundary of ![]() th
layer (=bedrock) is given by
th
layer (=bedrock) is given by
un = ui exp(iat)
where ω
is the angular frequency and ![]() is a constant. Displacement amplitude in arbitrary
is a constant. Displacement amplitude in arbitrary ![]() th
layer is expressed with summation of downward transmitting wave
th
layer is expressed with summation of downward transmitting wave ![]() and upward transmitting wave
and upward transmitting wave ![]() .
.
![]()
![]()
where ![]() is depth that is measured downward from upper boundary of
is depth that is measured downward from upper boundary of ![]() th
layer and
th
layer and ![]() .
.
Time term exp(iat)
is omitted, and displacement ![]() and stress
and stress ![]() in
in ![]() th
layer is expressed by matrix as follows:
th
layer is expressed by matrix as follows:
 .
.
Derived from continuity condition of
displacement and stress between upper boundary of ![]() th
layer and lower boundary of (
th
layer and lower boundary of (![]() )th
layer,
)th
layer,

 .
.
By using this recurrence formula iteratively, displacement and stress at ground surface can be computed by
 .
.
Stress at ground surface is zero and
displacement amplitude of incident S wave is given by ![]() ,
then an above equation is developed as
,
then an above equation is developed as
![]()
![]() .
.
Therefore frequency-transfer function![]() ,
that is the ratio of surface to incident amplitude in frequency domain,
is given by
,
that is the ratio of surface to incident amplitude in frequency domain,
is given by
 .
.
Taking intrinsic attenuation parameter ![]() into consideration, complex shear modulus
into consideration, complex shear modulus ![]() needs to be substitute for shear modulus
needs to be substitute for shear modulus ![]() in above-mentioned equations.
in above-mentioned equations.
(3)Note
Because this method does not consider non-linear behavior of soil, predicted amplitude at soft-soil sites, particularly sand deposit, is overestimated compared with observed amplitude when incident S wave has large amplitude.
This method need many parameters for each layer, but it is exceptional that parameters such as S-wave velocity is observed in research area even if there are many drilling data. Therefore it is necessary to infer unknown parameters using conversion formulas with N value as input, because N value is usually recorded in drilling data in Japan.
(4)Reference
Haskell, N. A. (1960) Crustal reflection of plane SH waves, J. Geophys. Res., 65, 4147-4150.
In general, soil has characteristic that shear modulus decreases and damping factor increases as shear strain increases. In this method, calculation is executed with following steps to consider this characteristic (see also Fig.1.2.2).
Step (1)
Modeling of soil structure with parameters necessary for calculation and calculation of shear modulus and damping factor on the assumption that shear strain is slight
Step (2)
Execution of response analysis for given incident waveform and calculation of time series of shear strain for each layer
Step (3)
Calculation of new shear modulus corresponding to 60 percent of maximum shear strain, which is given by response analysis, using strain-dependent curves of shear modulus and damping factor
Step (4)
Calibration of soil structure model with newly gained shear modulus and damping factor
Step (5)
Iteration of the calculation from Step (2) to Step (4) until shear modulus and damping factor converge
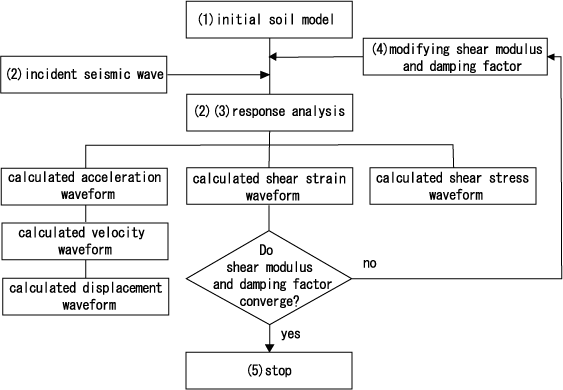
Fig.1.2.2 Flow chart of equi-linearized technique
(3)Note
Equivalent linear approach of non-linear response called SHAKE (Schnabel et al., 1972) is one of the typical methods, which consider strain-dependency in physical properties of soil. Equivalent linear approach of non-linear response is more suitable to actual behavior of soil than multi-reflection theory as described in 1.2.1. However, predicted amplitude at soft-soil sites, particularly sand deposit, is underestimated compared with observed amplitude, because shear strain become too large when incident S wave has large amplitude.
To improve this problem in SHAKE, the frequency dependent effect of shear modulus and damping factor is taken into consideration in FDEL (Sugito et al., 1994).
These methods need many parameters for each layer, but it is exceptional that parameters such as S-wave velocity is observed in research area even if there are many drilling data. Therefore it is necessary to infer unknown parameters using conversion formulas with N value as input, because N value is usually recorded in drilling data in Japan.
(4)Reference
Schnabel, P. B., J. Lysmer and H. B. Seed (1972) SHAKE a computer program for earthquake response analysis of horizontally layered sites, EERC, 72-12.
Sugito, M., G. Goda and T. Masuda (1994) Frequency dependent equi-linearized technique for seismic response analysis of multi-layered ground, Proceedings of JSCE, 493, 49-58 (in Japanese with English abstract).
Using the observed strong motion data
for the 1987 Chiba-ken-toho-oki Earthquake, Midorikawa et al. (1994)
proposes the following equations which can calculate the site amplification
for peak ground acceleration (![]() )
and velocity (
)
and velocity (![]() ) with the time-weighted
average shear wave velocity to a depth of 30m (
) with the time-weighted
average shear wave velocity to a depth of 30m (![]() in m/s) as input.
in m/s) as input.

where ![]() is given by the following equation for each soil type (Matsuoka and Midorikawa,
1994).
is given by the following equation for each soil type (Matsuoka and Midorikawa,
1994).
![]()

The regression coefficients of ![]() are summarized in Table 1.2.1.
are summarized in Table 1.2.1.
Table 1.2.1 Regression coefficients for each soil type (Matsuoka and Midorikawa, 1994)
|
unit or Geology |
|
|
|
σ |
|
| Reclaimed Land |
2.23
|
0
|
0
|
0.14
|
132
|
| Artificial Transformed Land |
2.26
|
0
|
0
|
0.09
|
7
|
| Delta, Back
Marsh ( |
2.19
|
0
|
0
|
0.12
|
36
|
| Delta, Back
Marsh ( |
2.26
|
0
|
0.25
|
0.13
|
57
|
| Natural Levee |
1.94
|
0.32
|
0
|
0.13
|
18
|
| Valley Plain |
2.07
|
0.15
|
0
|
0.12
|
26
|
| Sand Bar, Dune |
2.29
|
0
|
0
|
0.13
|
13
|
| Fan |
1.83
|
0.36
|
0
|
0.15
|
20
|
| Loam Plateau |
2.00
|
0.28
|
0
|
0.11
|
95
|
| Gravel Plateau |
1.76
|
0.36
|
0
|
0.12
|
12
|
| Hill |
2.64
|
0
|
0
|
0.17
|
22
|
| Other Geom.
Units
(e.g. Volcanic Mountain) |
2.25
|
0.13
|
0
|
0.16
|
10
|
| Pre-Tertiary |
2.87
|
0
|
0
|
0.23
|
3
|
Peak ground acceleration (or velocity) at surface can be obtained by multiplying the amplification factor and peak ground acceleration (or velocity) on engineering bedrock together. In this method engineering bedrock indicates the layer where S-wave velocity is 600m/s.
(3)Note
Because this method derived from the dataset mainly recorded in Kanto district in Japan, calculation result is not guaranteed except Kanto district.
In order to adapt this method to other
area in Japan, Geological Survey of Japan (1996) decided maximum and minimum
value for ![]() ,
, ![]() ,
, ![]() for each geomorphological unit or Geology.
for each geomorphological unit or Geology.
Table 1.2.2 Maximum and minimum value
for ![]() ,
, ![]() ,
, ![]()
(Geological Survey of Japan, 1996)
|
unit or Geology |
|
|
|
| Reclaimed Land |
|
|
|
| Artificial Transformed Land |
|
|
|
| Delta, Back
Marsh ( |
|
|
|
| Delta, Back
Marsh ( |
|
|
|
| Natural Levee |
|
|
|
| Valley Plain |
|
|
|
| Sand Bar, Dune |
|
|
|
| Fan |
|
|
|
| Loam Plateau |
|
|
|
| Gravel Plateau |
|
|
|
| Hill |
|
|
|
| Other Geom.
Units
(e.g. Volcanic Mountain) |
|
|
|
(4)Reference
Geological Survey of Japan (1996) Zenkoku katsu dansou kikendo hyouka sagyou houkokusho (in Japanese. Webmaster translates the title “Report of hazard assessment for active fault in Japan”).
Matsuoka M. and S. Midorikawa (1994) The digital national land information and seismic microzoning, 22nd symposium of earthquake ground motion, 23-34 (in Japanese with English abstract).
Midorikawa, S., M. Matsuoka and K. Sakugawa (1994) Site Effects on Strong-Motion Records Observed during the 1987-Chiba-ken-toho-oki, Japan Earthquake, Proc. Ninth Japan Earthq. Engnrg. Sympo., E085-E090.