| Tonga Tsunami on Jan. 15, 2022 |
We simulated the tsunamis generated from the Tong volcano eruption (04:14:45 (UTC), 20.546ºS, 175.390ºW, depth = 0.0 km, M = 5.8 according to
USGS) on January 15, 2022 (Fig. 1). The assumed tsunami source is located in the volcano area.
We modeled an atmospheric pressure (Lamb) wave as the moving sea surface elevation. The amplitude of propagating source decays with a distance on a sphere surface, 1/sqrt(R*sin(Δ)), R: Earth radius, Δ: epicentral angle distance. We assumed a circular source starting at the eruption time with an initial amplitude of 4.0 m, a rise time of 10 min and a speed of 0.31 km/s.
For the tide gauge or DART stations in and around the Pacific Ocean, the tsunami computation area ranges 240ºW – 68ºW and 55ºS – 61ºN. The 30 arc-sec bathymetry grid data from GEBCO_2014 [Weatherall et al., 2015] was resampled with a 24 arc-sec grid interval, thus the number of computation grids are 25,800 and 17,400 in the longitude and latitude directions, respectively. We numerically solved the linear long wave equations [Satake, 1995] in the spherical coordinate system for 20-hour tsunami propagation with a time interval of 1 sec to satisfy the stability condition. We have downloaded the DART data and Tide gauge data from NOAA's and UNESCO/IOC's web sites, respectively. The data of DART stations in New Zealand were provided by GNS Science.The tide gauge data in Japan were provided by JMA, GSI, JODC. We compared the simulated tsunami waveforms and the observed ones (Fig. 2). We can see the tsunami propagation in the Pacific Ocean (Fig. 3).
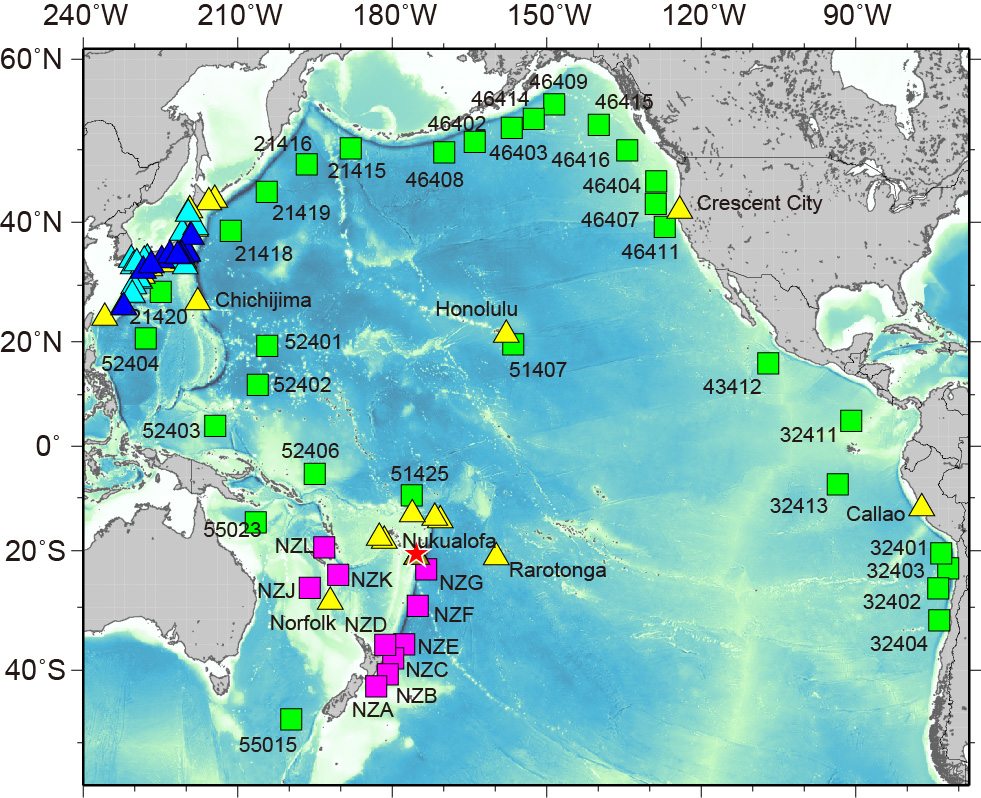
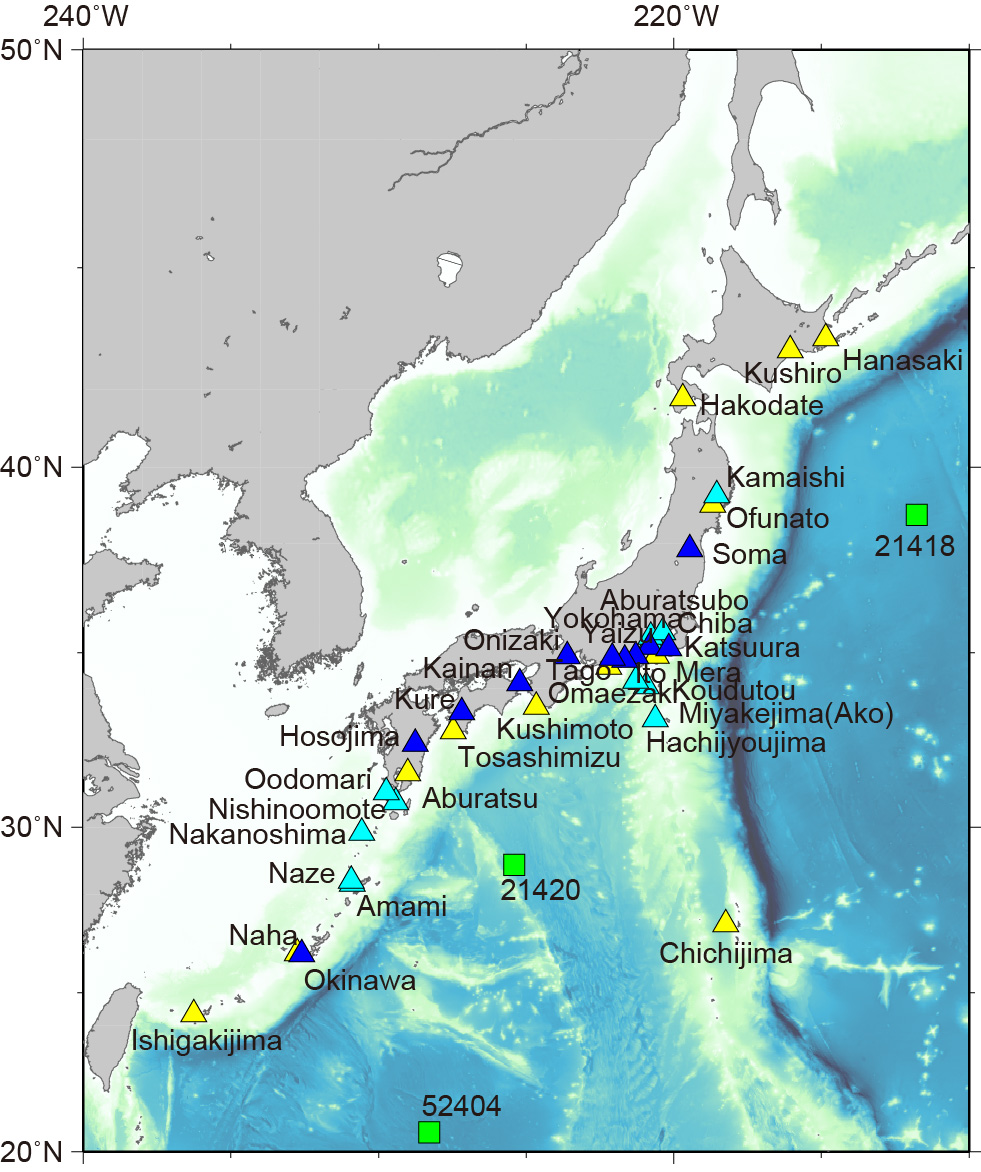
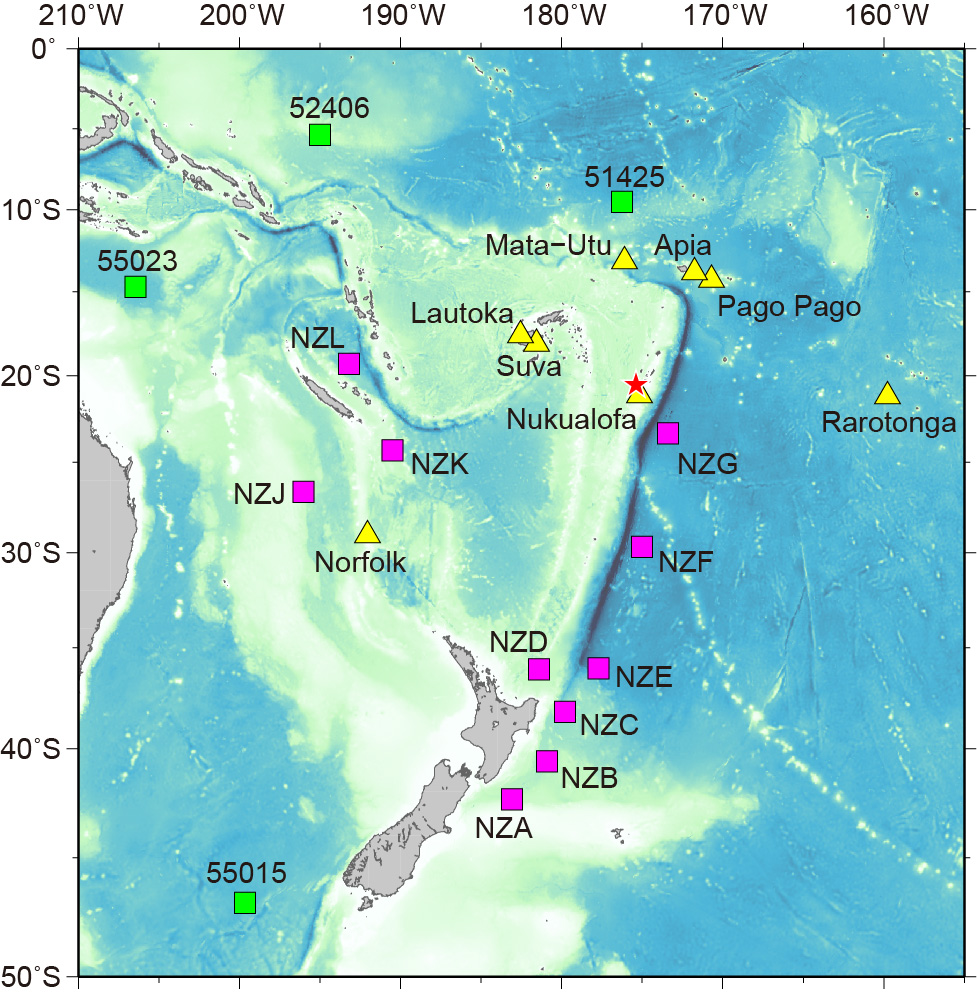
Fig.1 Tsunami Computation Area
The squares and triangles indicate DART and tide gauge stations, respectively.
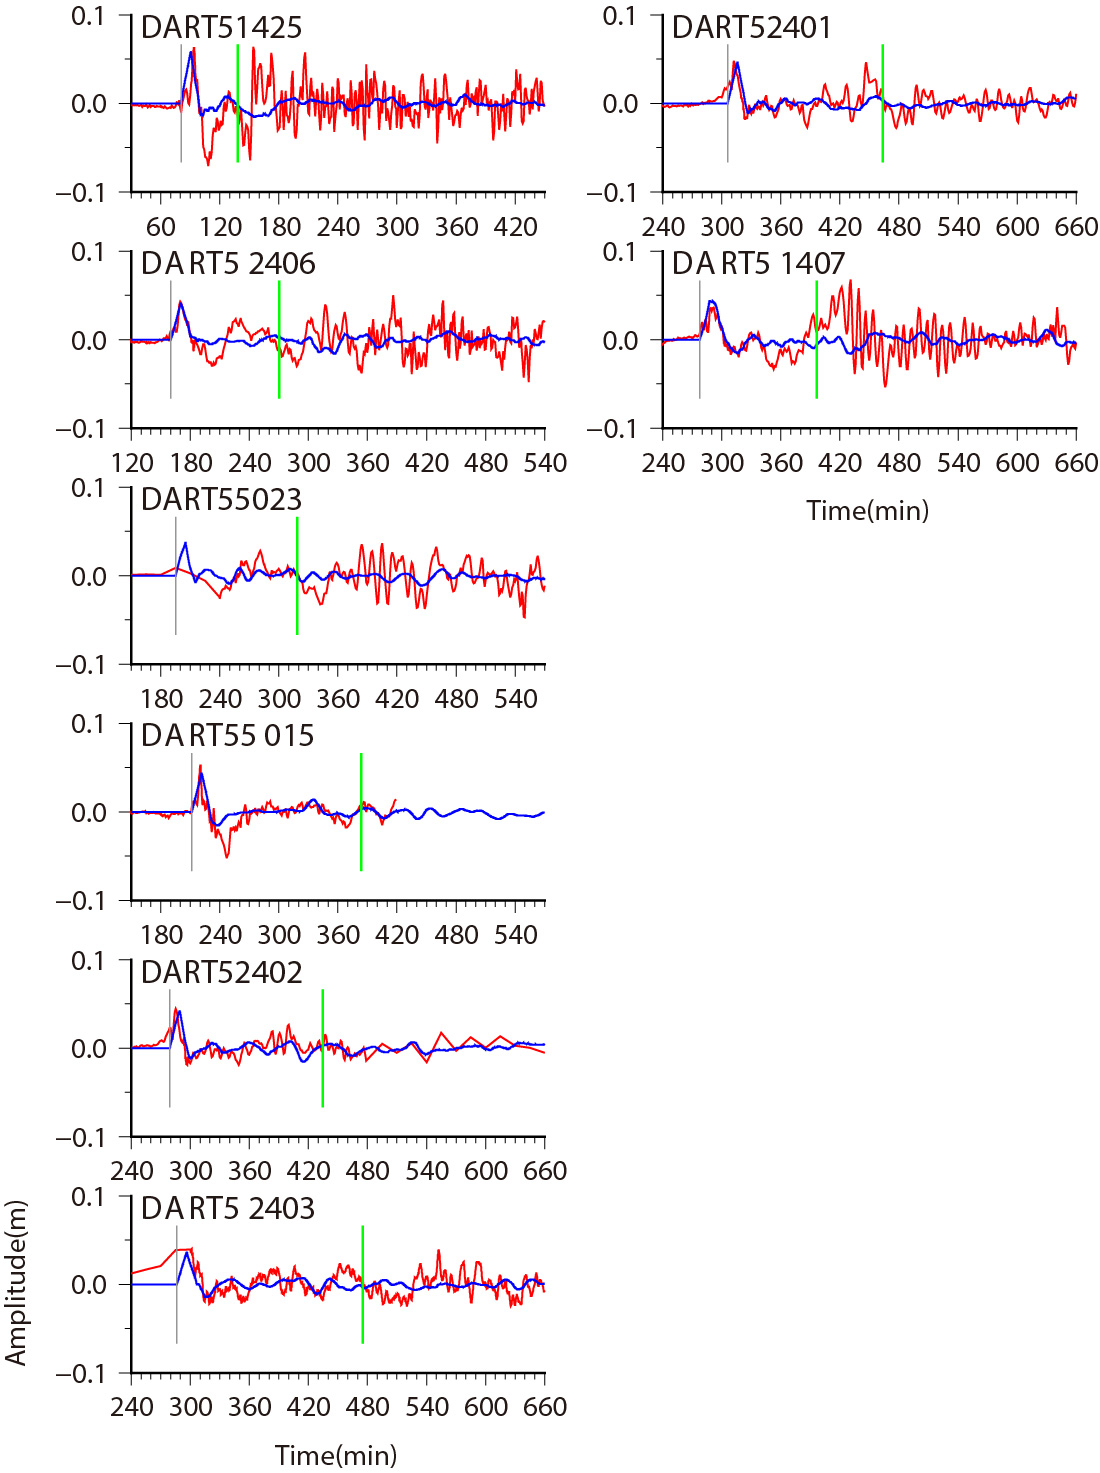
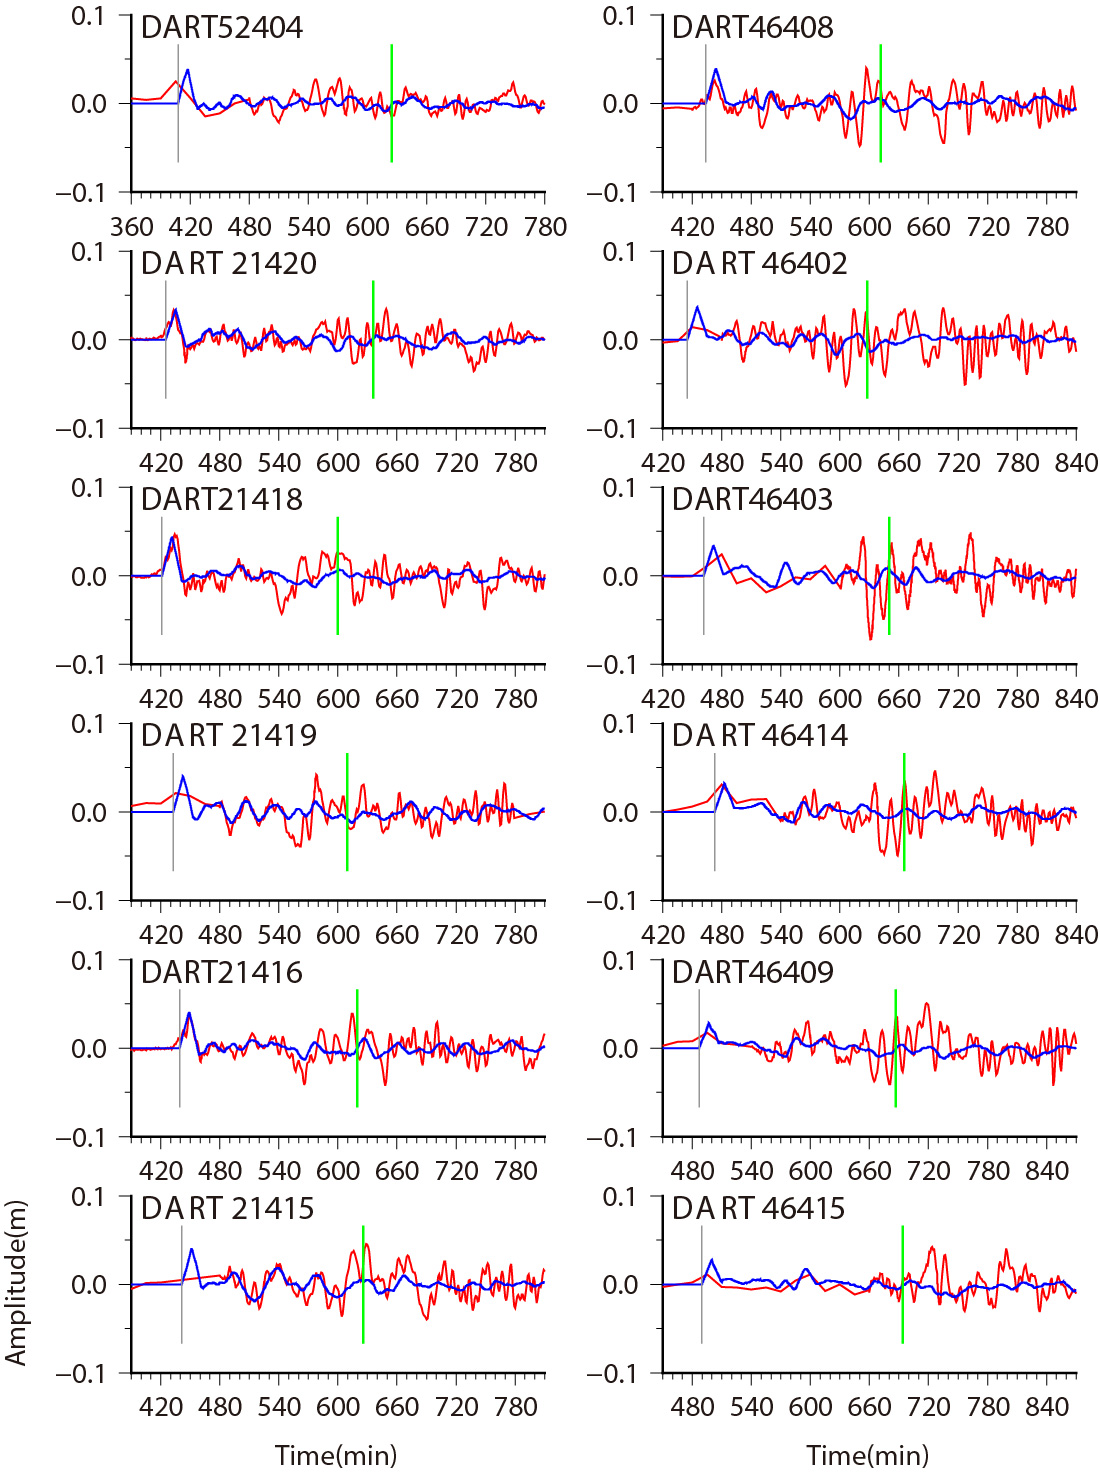
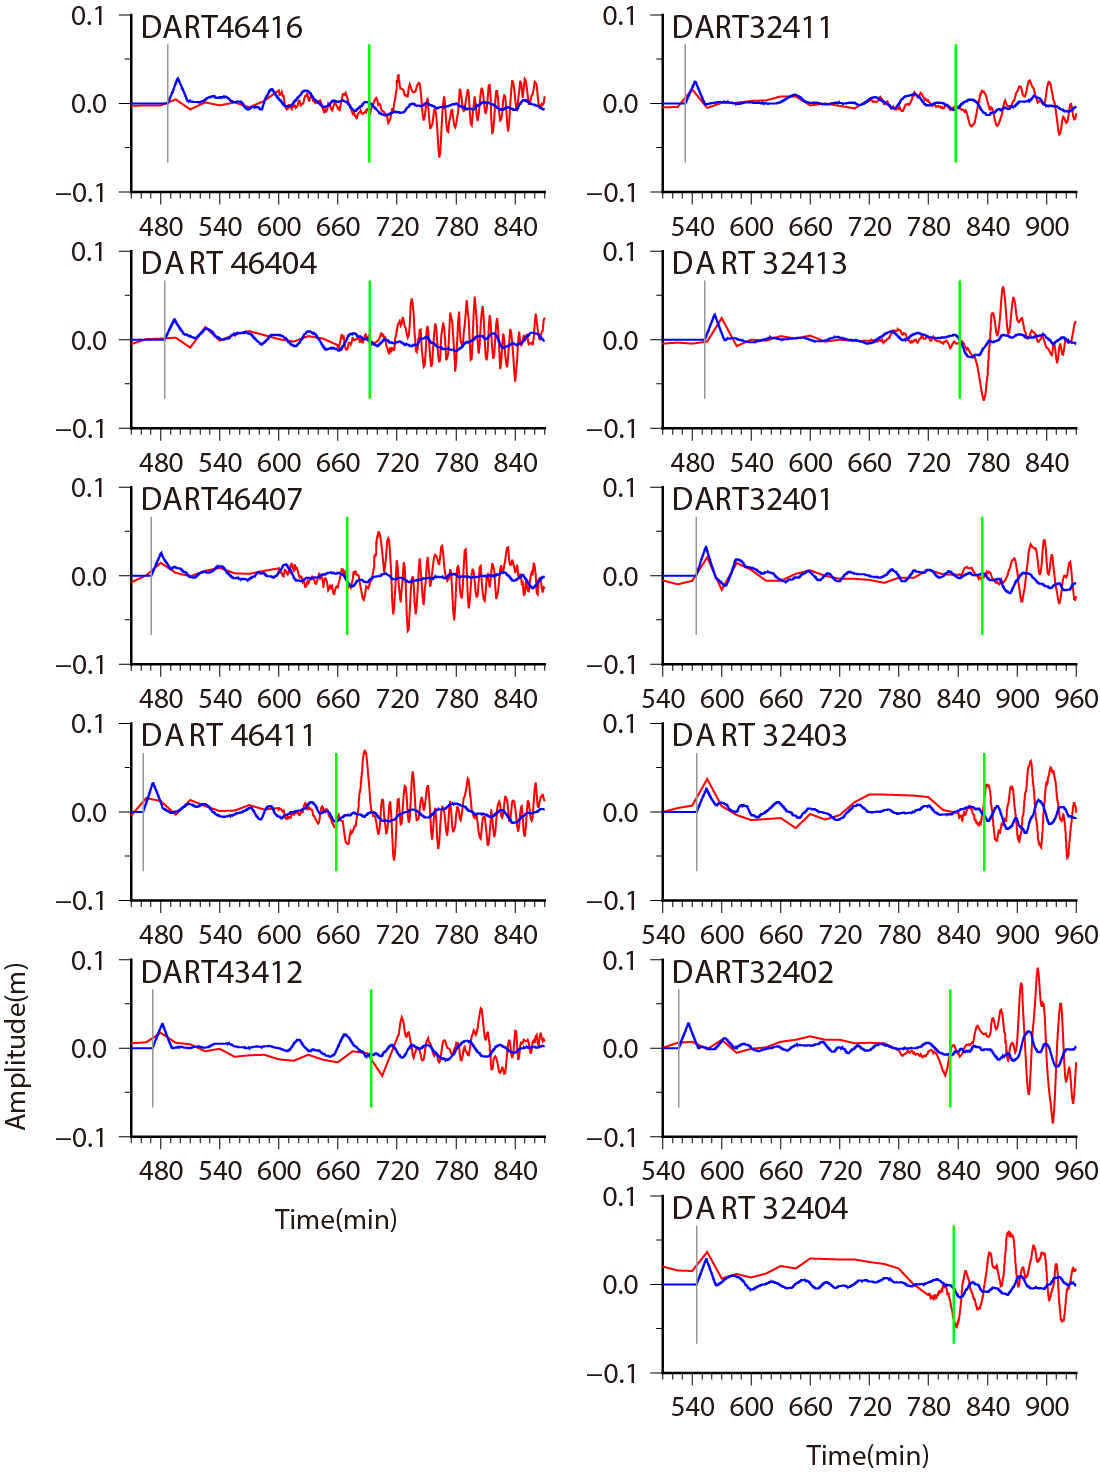
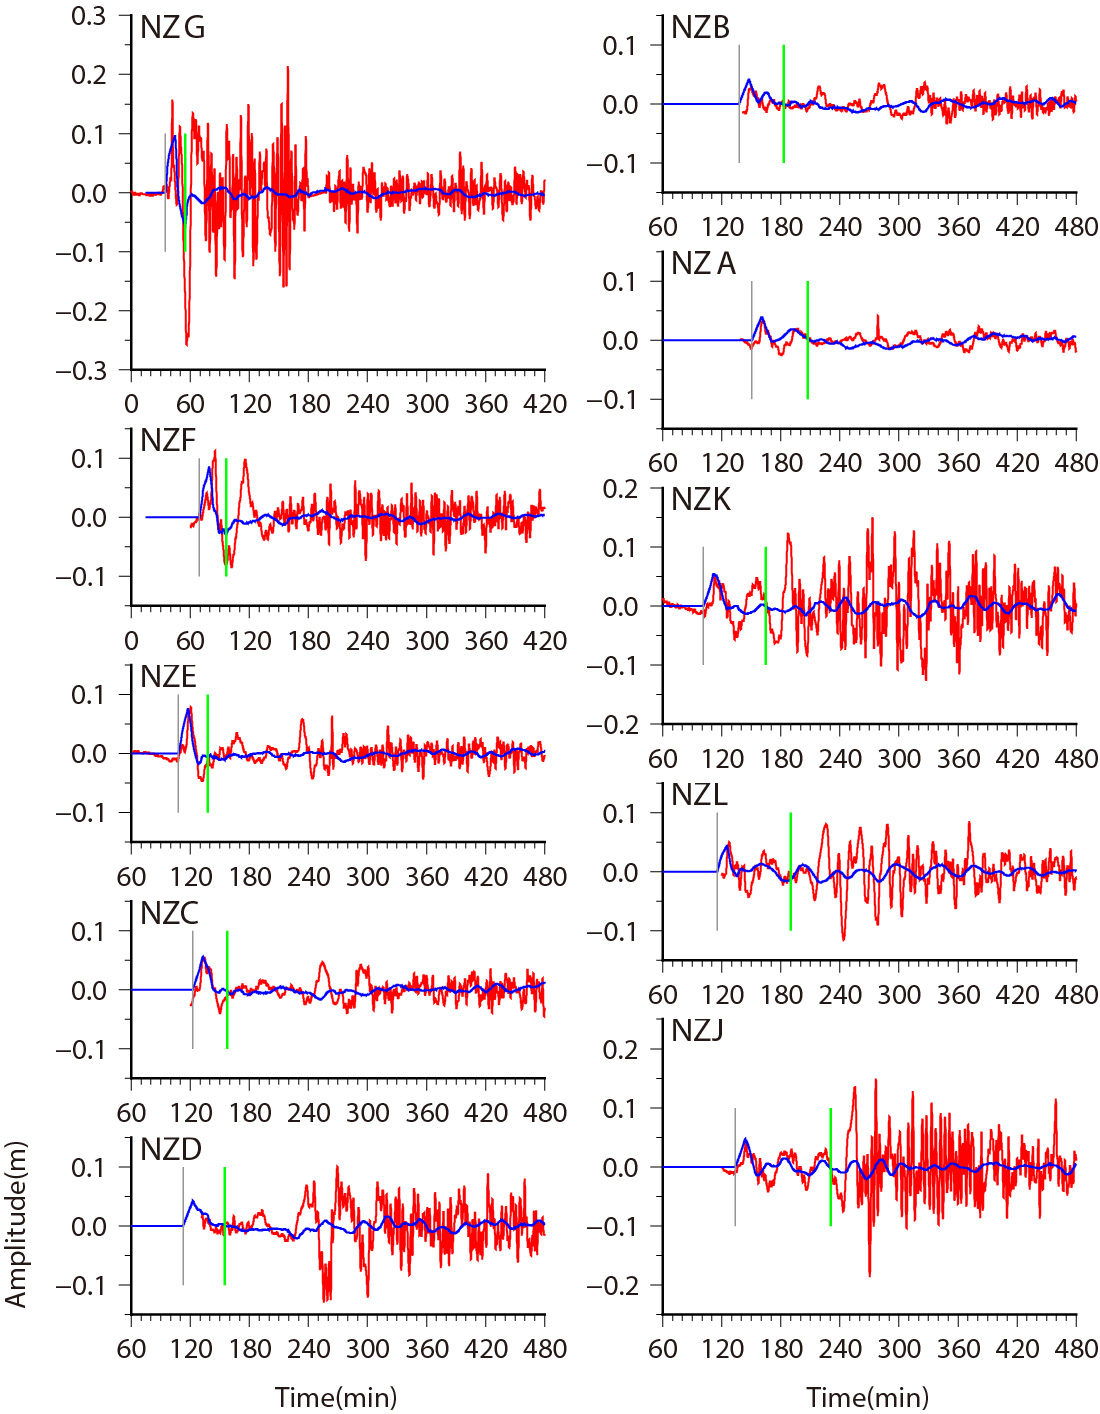
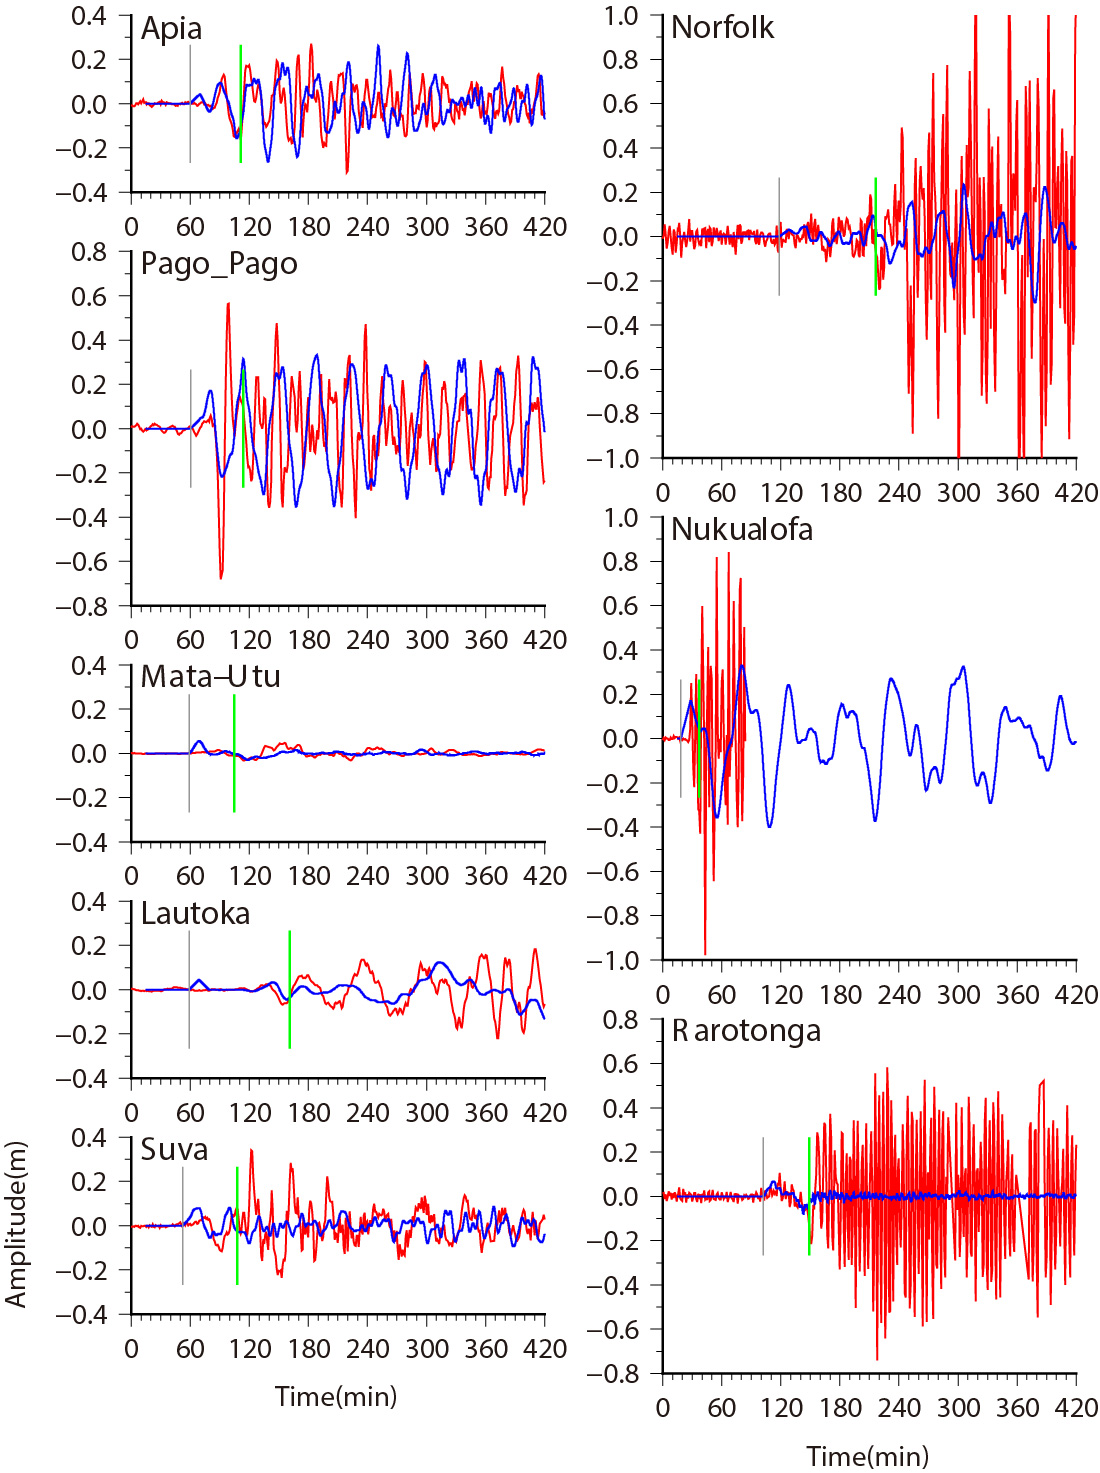
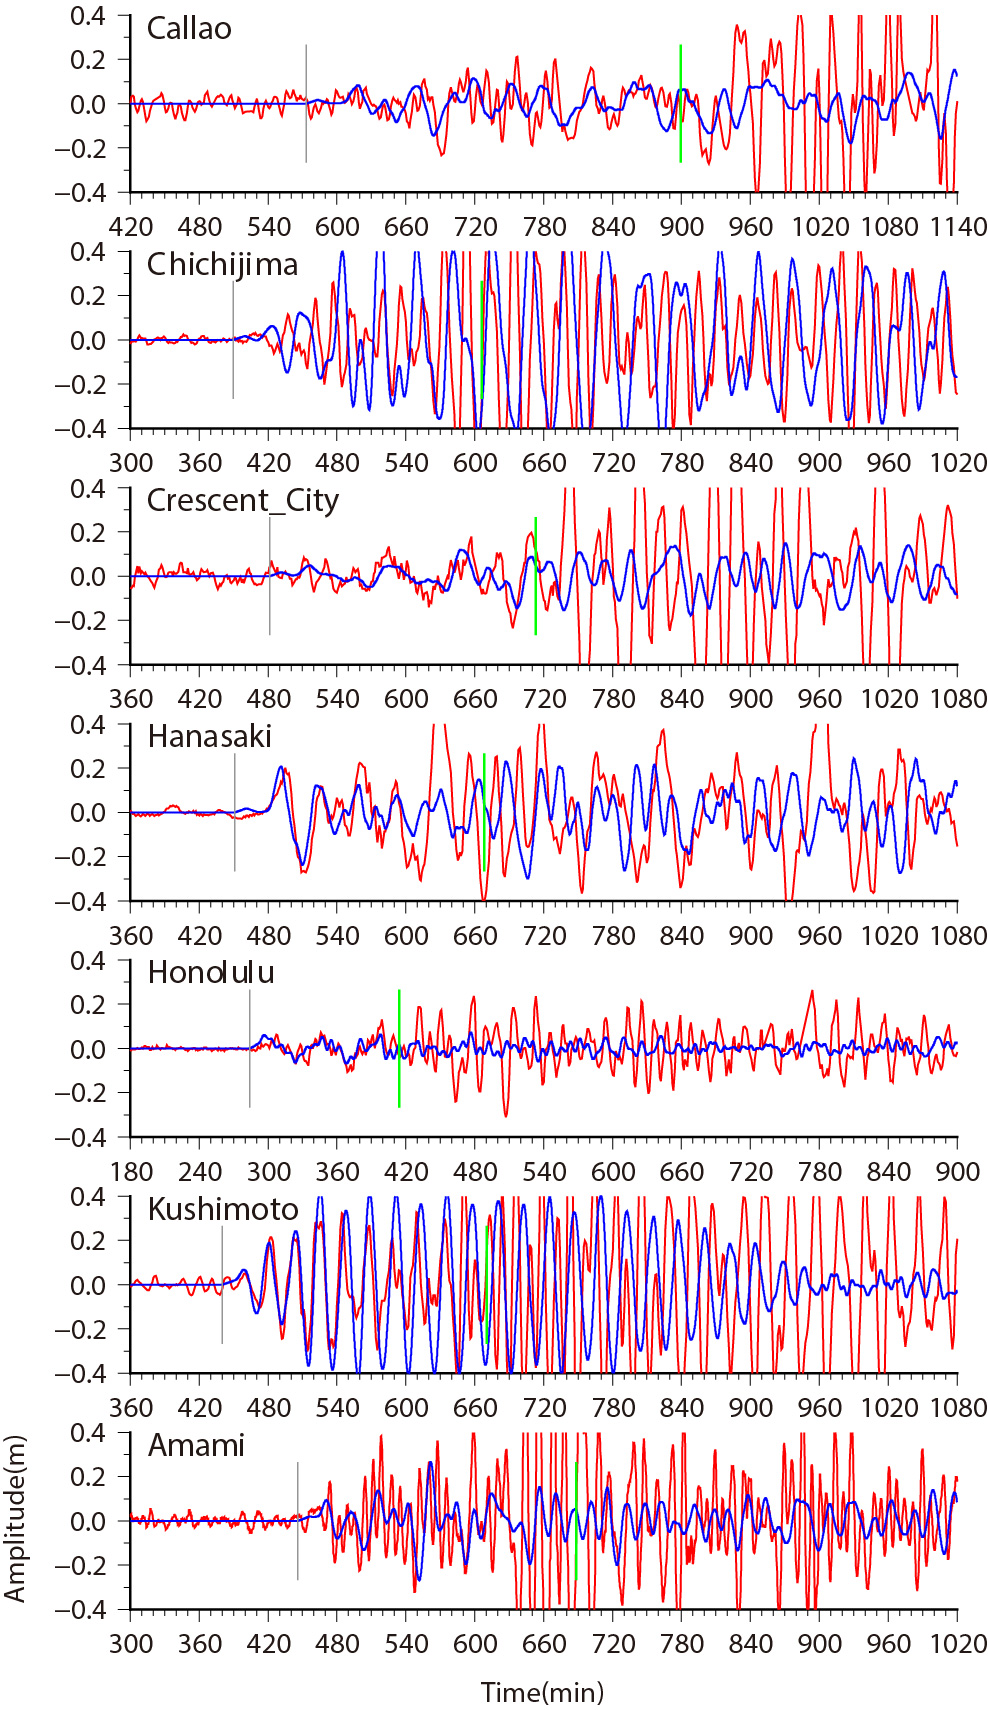
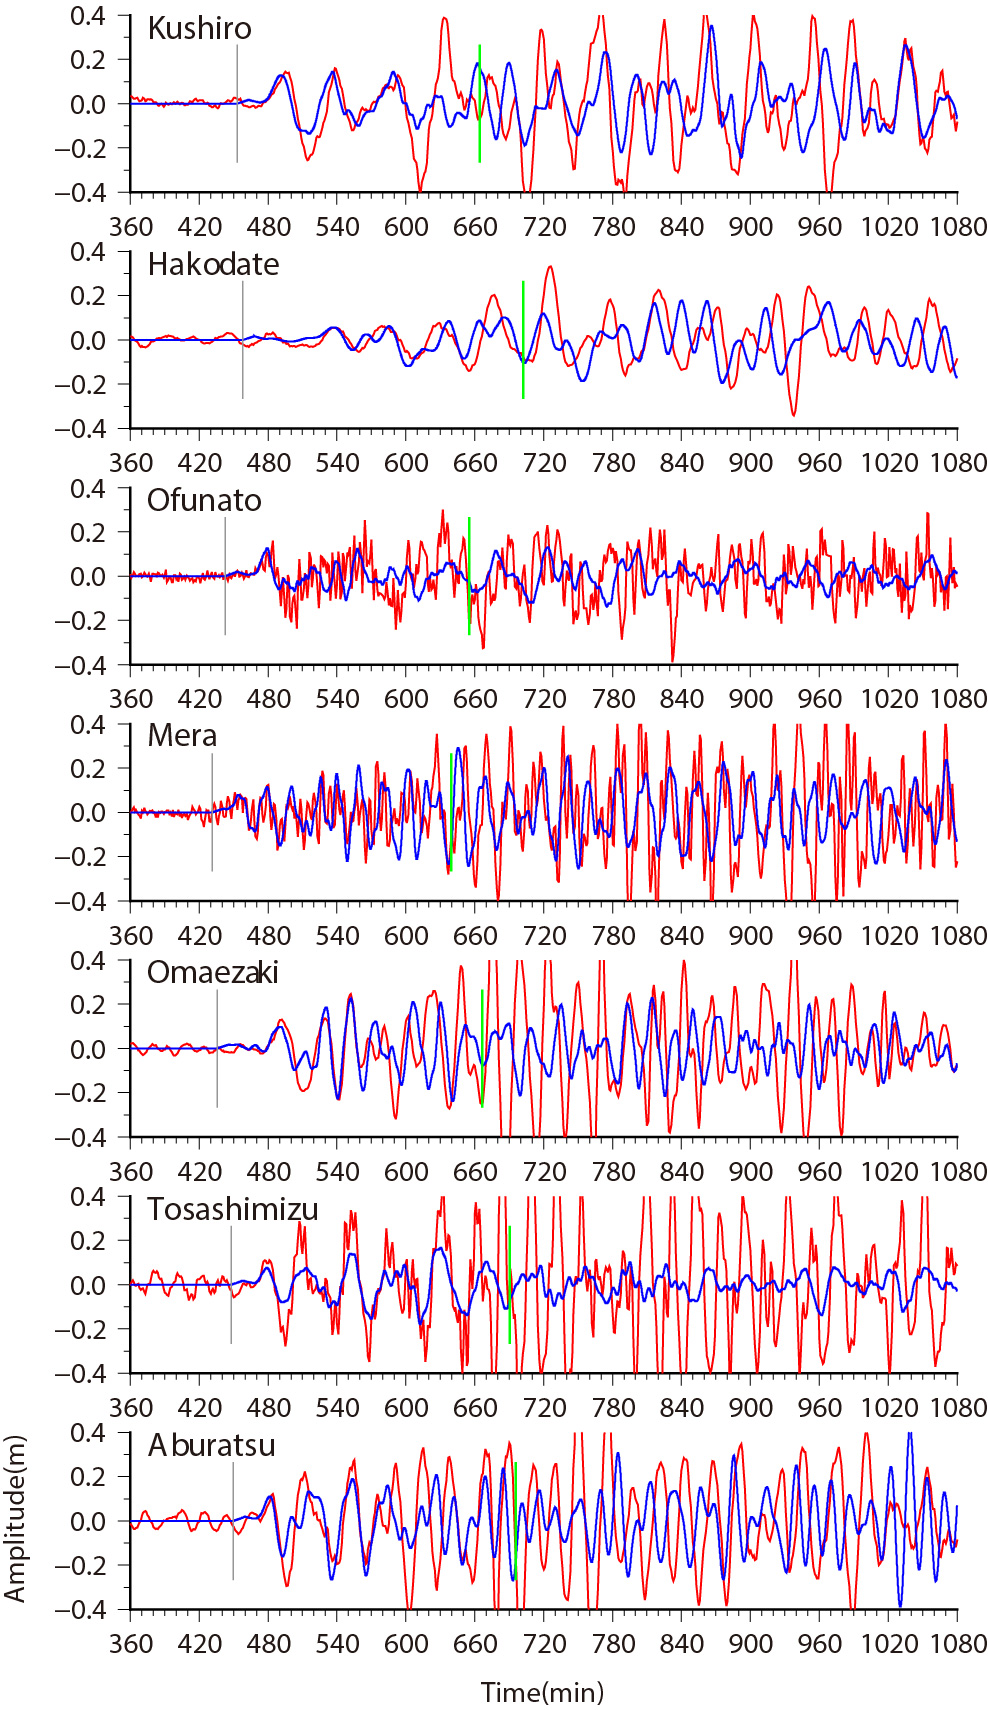
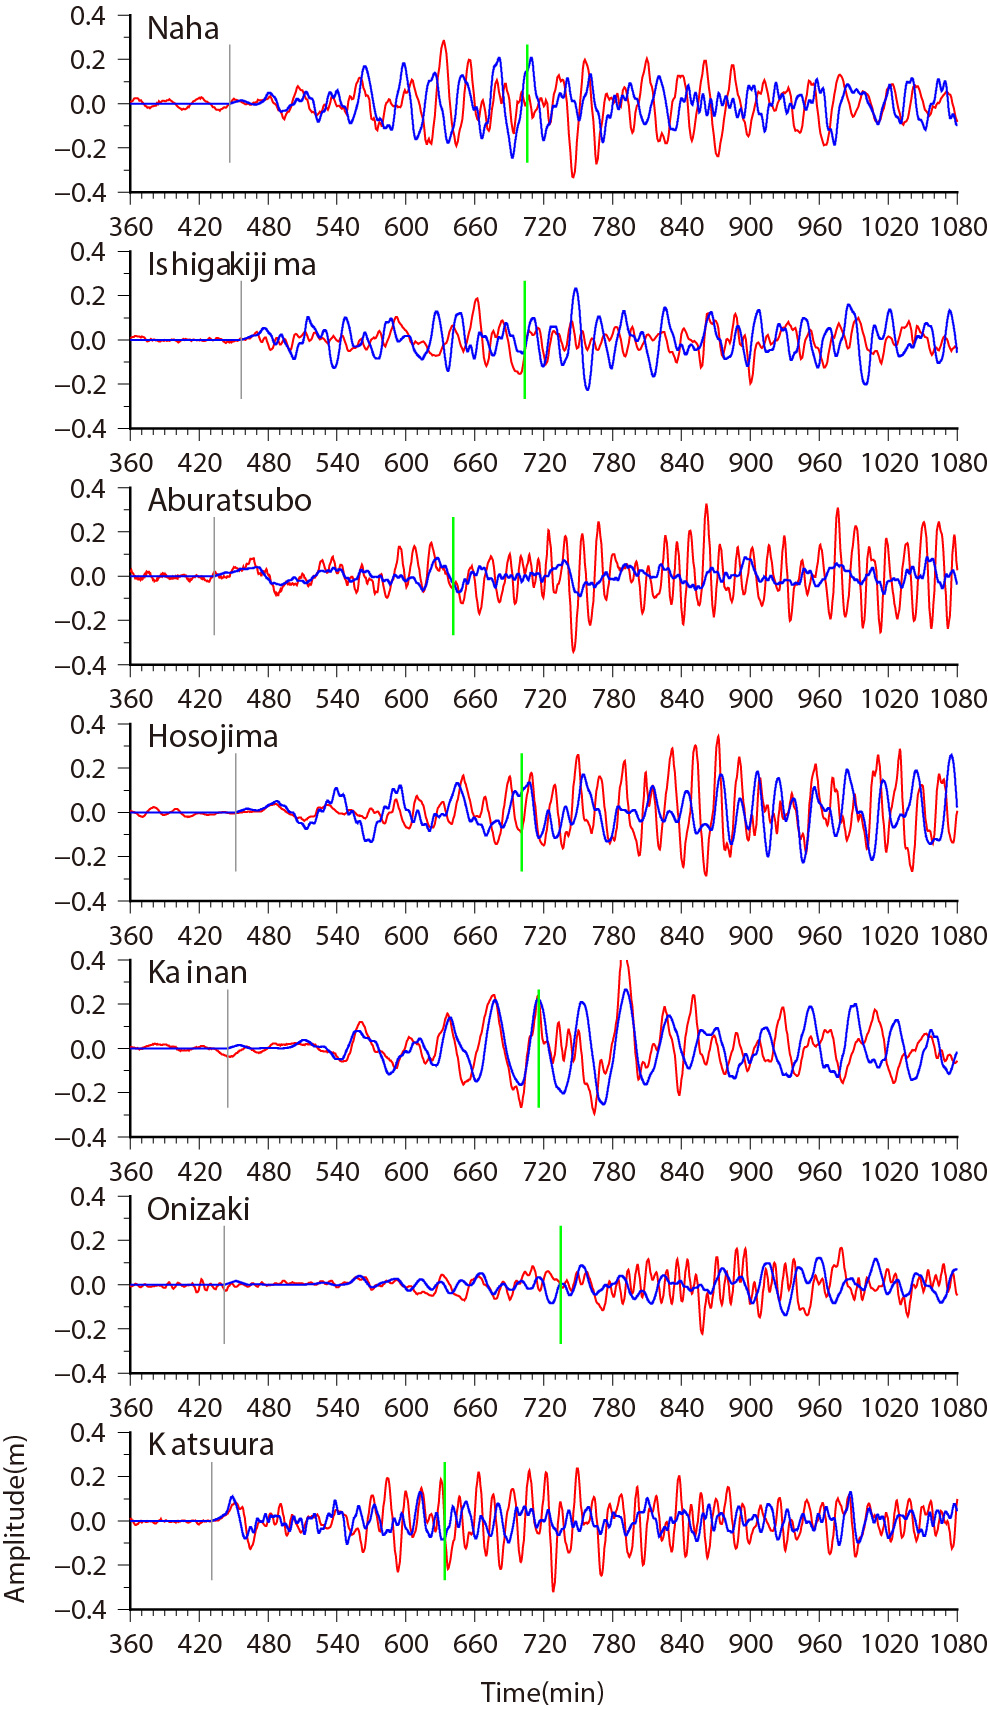
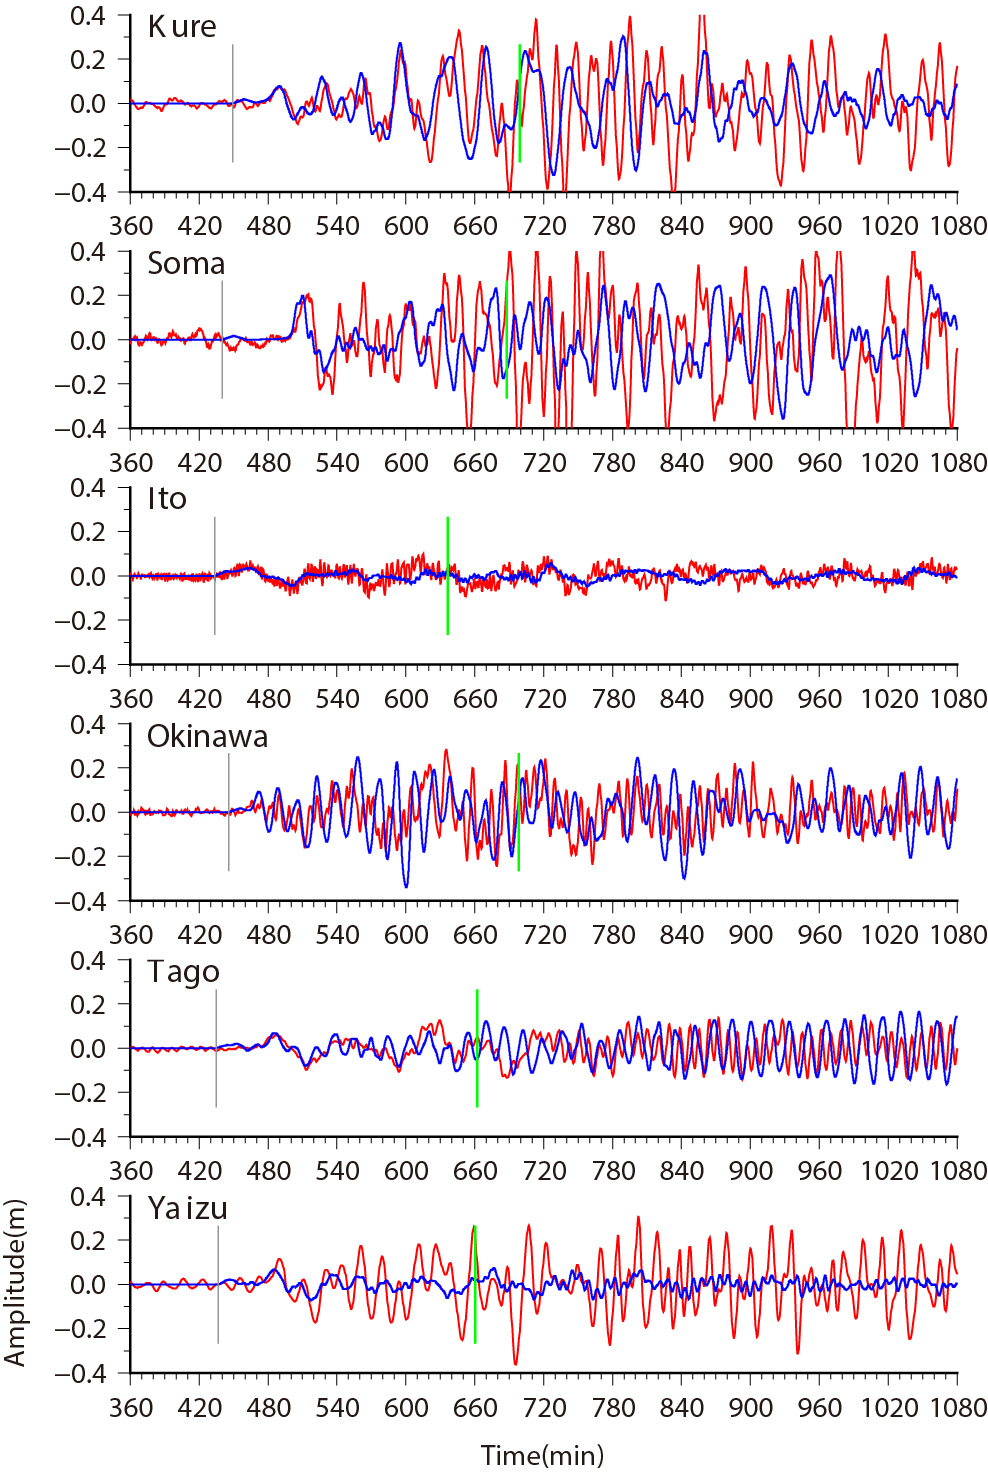
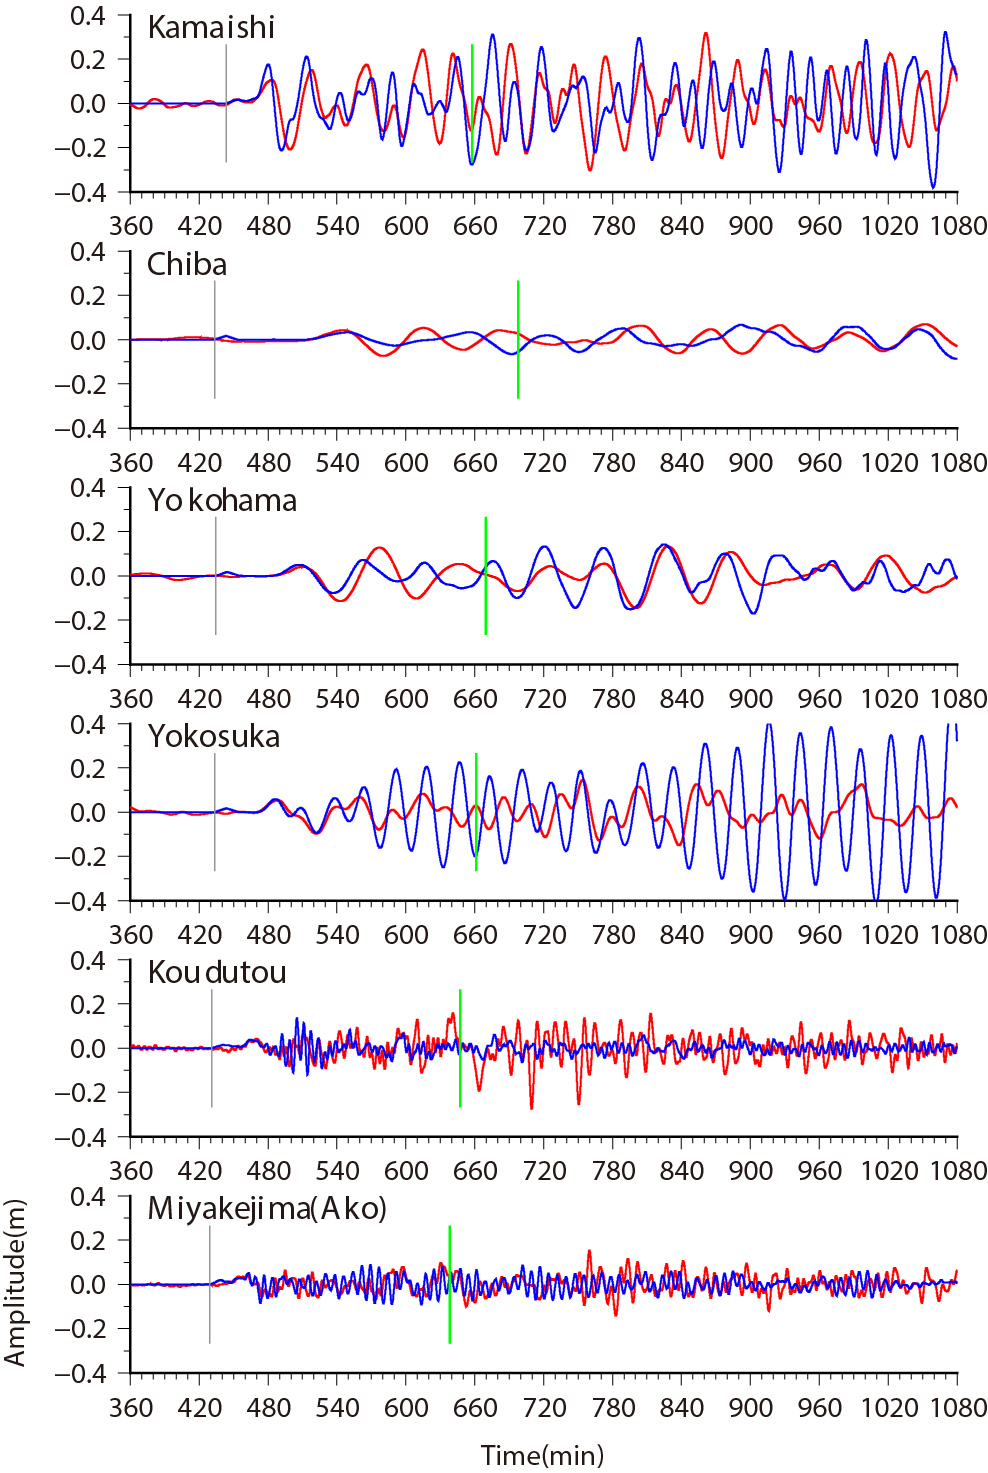
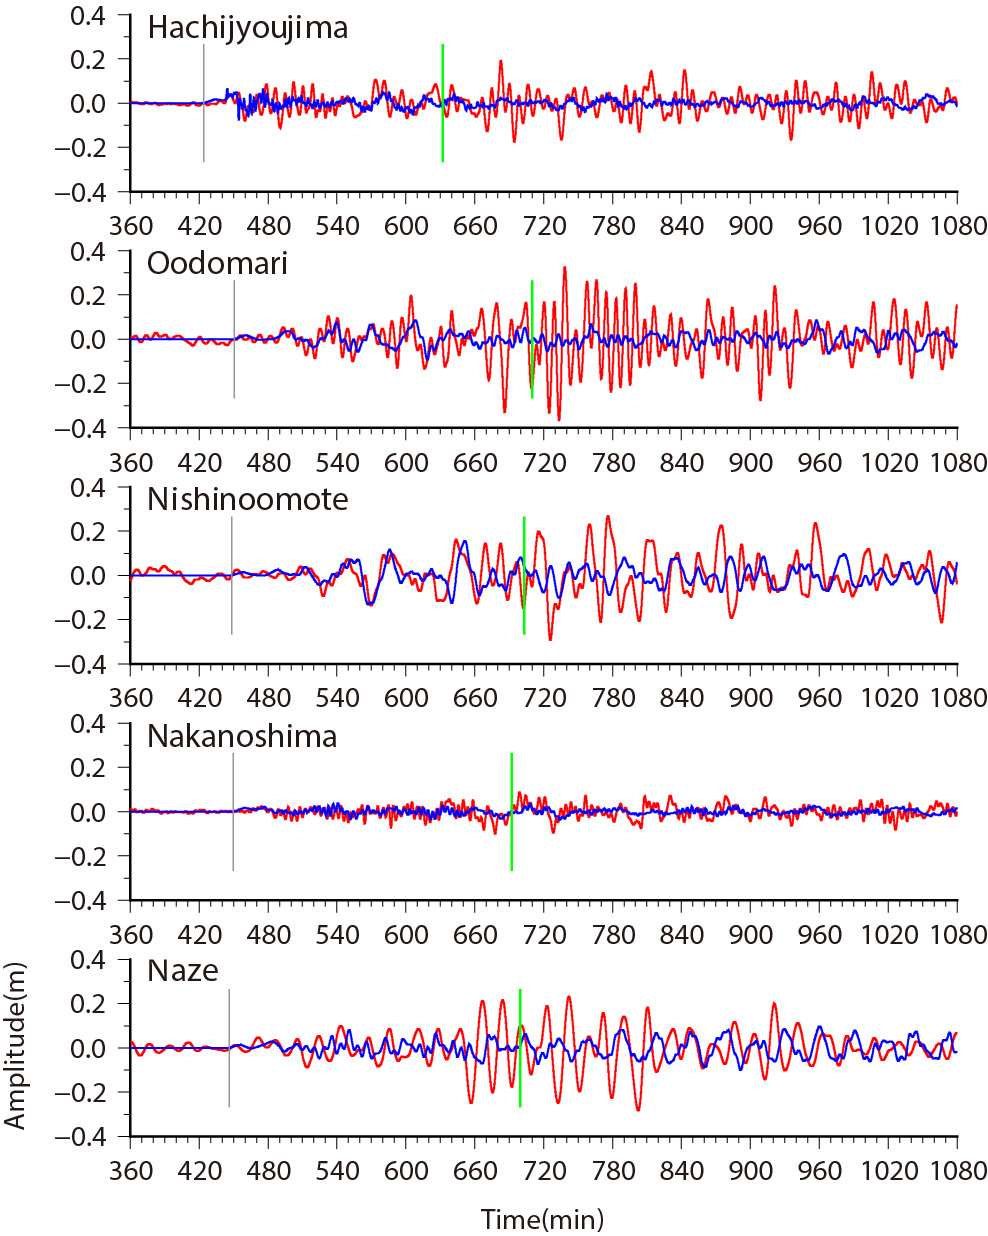
Fig.2 Comparison of Obsereved and Simulated Tsunami Waveforms
Solid lines in red indicate the observed tsunami waveforms. The blue lines are calculated tsunami waveforms.
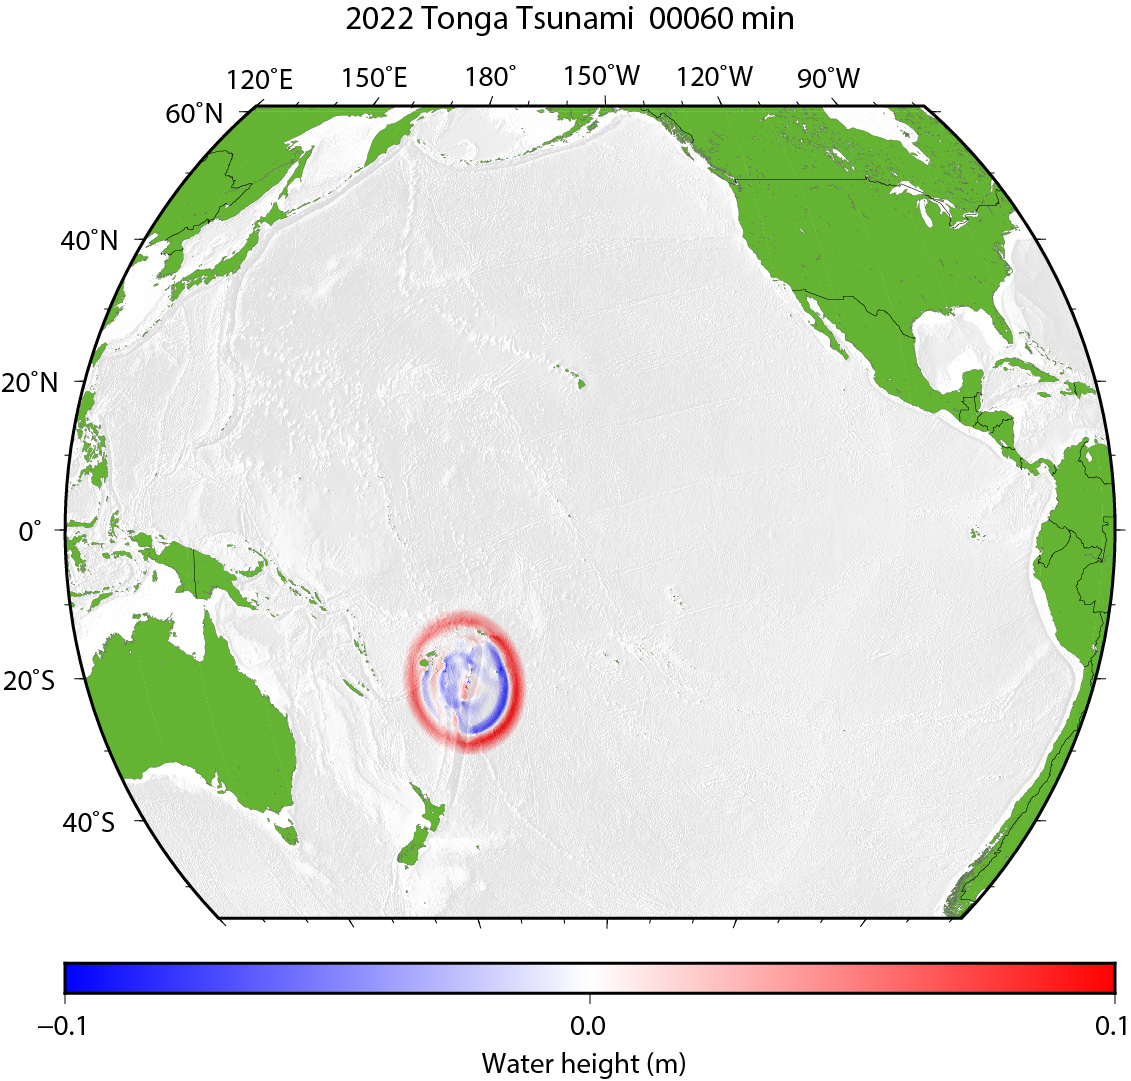
Fig.3 Tsunami Propagation (Click to start animation)
The red color means that the water surface is higher than normal sea level, while the blue means lower.
| by Yushiro Fujii (IISEE, BRI) and Kenji Satake (ERI, Univ. of Tokyo) |
|
|
| References |
|
Satake, K. (1995), Linear and Nonlinear Computations of the 1992 Nicaragua Earthquake Tsunami, Pure and Appl. Geophys., 144, 455-470. Weatherall, P., Marks, K. M., Jakobsson, M., Schmitt, T., Tani, S., Arndt, J. E., et al. (2015). A new digital bathymetric model of the world's oceans. Earth and Space Science, 2(8) |
Last Updated on 2022/2/10