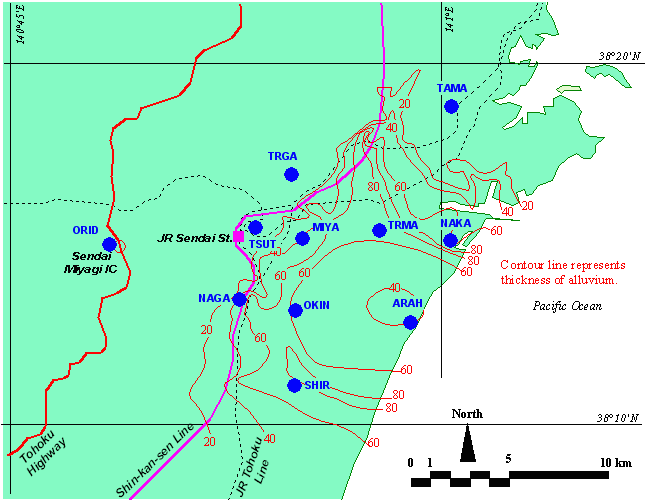
Fig.1 Location of observation sites in Sendai. Contour lines indicate thickness
of alluvium.
Fig.2 Block diagram of observation system. Observation sites and the sub-controlling-center
are located in Sendai.
Fig.3 Fourier spectral ratio at MIYA site.
Fig.4 Fourier spectral ratio at NAKA site.
Fig.5 Fourier spectral ratio at TAMA site.
Fig.6 Fourier spectral ratio at ORID site.
Fig.7 Fourier spectral ratio at TSUT site.
Fig.8 Fourier spectral ratio at TRMA site.
Fig.9 Fourier spectral ratio at OKIN site.
Fig.10 Fourier spectral ratio at SHIR site.
Fig.11 Fourier spectral ratio at TRGA site.
Fig.12 Fourier spectral ratio at NAGA site.
Fig.13 Fourier spectral ratio at ARAH site.
